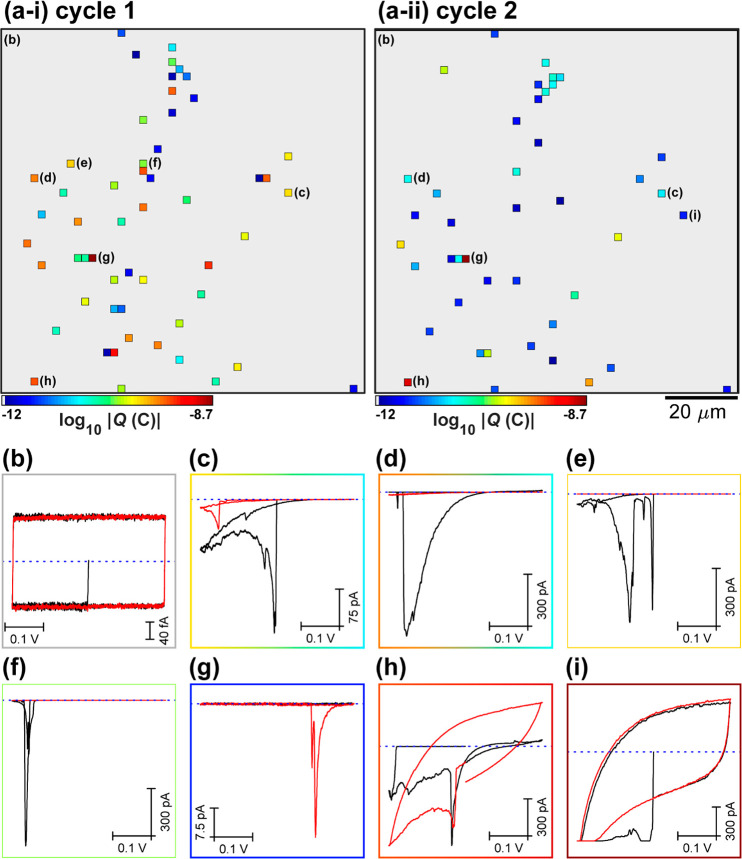
Figure 3.
(a) Static images of electrochemical activity (proton transmission), collected over a 100 × 100 μm2 area of the graphene|Nafion membrane, using SECCM in the voltammetric (υ = 0.2 V s–1, 2 cycles) hopping mode configuration (hopping distance = 2 μm, 51 × 51 pixels, tip area ≈1 μm2). (i) Cycle 1 and (ii) cycle 2 are shown separately. These images were obtained by integrating the spatially resolved |isurf| data from SI Movie S2 over the entire Esurf range (−0.225 to 0.175 V vs Ag/AgClQRCE). (b–i) Spatially resolved CVs (isurf–E curves), obtained by (b) averaging all inactive pixels (N = 2544) or (c–i) from the individual (representative) active pixels, indicated in (a). Cycles 1 and 2 are represented by the black and red traces, respectively.

