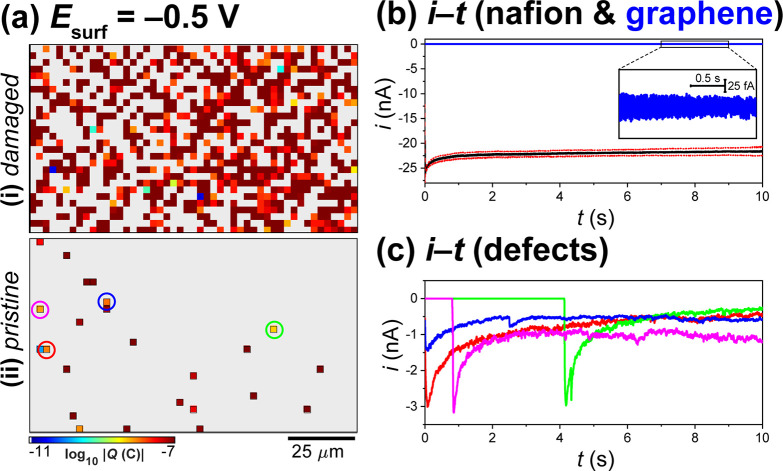
Figure 4.
(a) Static images of electrochemical activity (proton transmission), collected over a 120 × 70 μm2 area of a graphene|Nafion membrane, using SECCM in the amperometric (Esurf = −0.5 V vs Ag/AgClQRCE, t = 10 s) hopping mode configuration (hopping distance = 2.5 μm, 49 × 29 pixels, tip area ≈2 μm2). (i) “Damaged” and (ii) more intact (“pristine”) areas of the graphene|Nafion membrane are shown. These images were obtained by integrating the spatially resolved |isurf| data from SI Movies S3 and S4. (b) Chronoamperograms (isurf–t curves) extracted from (a-i), obtained from areas of the membrane where the Nafion is extruded through the graphene overlayer [i.e., dark-red pixels in (a-i); black trace in (b)] and the graphene overlayer remains intact [i.e., gray areas in (a-i), blue trace in (b)]. The Nafion curve in (b) was obtained by selecting 10 off-scale (i.e., dark-red) pixels that are surrounded by active pixels in (a); the resulting average (black line) ± one standard deviation (red dashed lines) curves are shown. (c) Chronoamperograms extracted from the individual proton transmission sites (pixels) labeled in (a-ii).

