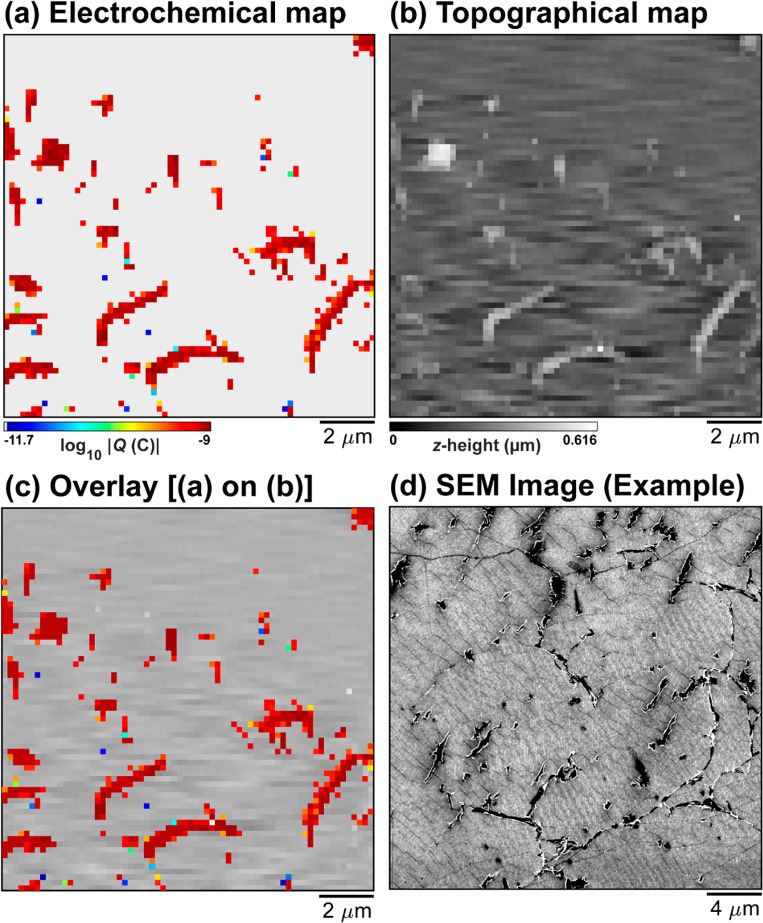
Figure 5.
(a) High-resolution electrochemical activity (log10|Q|) and (b) colocated quasi-topographical maps (measured synchronously), collected over a 13.4 × 13.8 μm2 area of a graphene|Nafion membrane, using SECCM in the voltammetric (υ = 1 V s–1, 1 cycle, Esurf = ± 0.25 V vs Ag/AgClQRCE) hopping mode configuration (hopping distance = 200 nm, 68 × 70 pixels, tip area ≈ 0.004 μm2). (c) Overlay of (a) on (b). (d) SEM image obtained from an adjacent area of the graphene|Nafion membrane, exhibiting similar features (i.e., macroscopic defects such as cracks and pinholes) as those imaged in (a) and (b).

