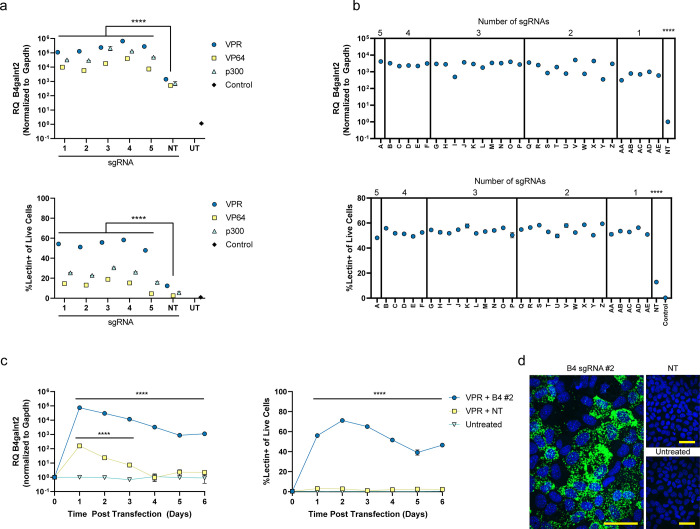
Figure 1.
In vitro gene activation of B4galnt2 in AML12 cells. (a) Single sgRNA screen by qPCR (top) and flow cytometry (bottom) at 24 h post-transfection. (b) Combinatorial screen of five sgRNAs by qPCR (top) and flow cytometry (bottom) at 24 h post-transfection. (c) Time course of gene activation by qPCR (left) and flow cytometry (right). (d) RNAscope assay against B4galnt2 mRNA (green) and DAPI (blue). Scale bar is 50 μm. B4 denotes B4galnt2 sgRNAs. NT denotes nontargeted sgRNAs. UT denotes untreated mice. RQ (relative quantification) denotes the fold change of B4galnt2 mRNA in treated samples relative to untreated samples and normalized to Gapdh mRNA for both. Data are presented as mean ± SEM (n = 3 biological replicates). Statistical significance was assessed using a two-way ANOVA followed by Dunnett’s multiple comparison between the nontargeted condition (****P < 0.0001).

