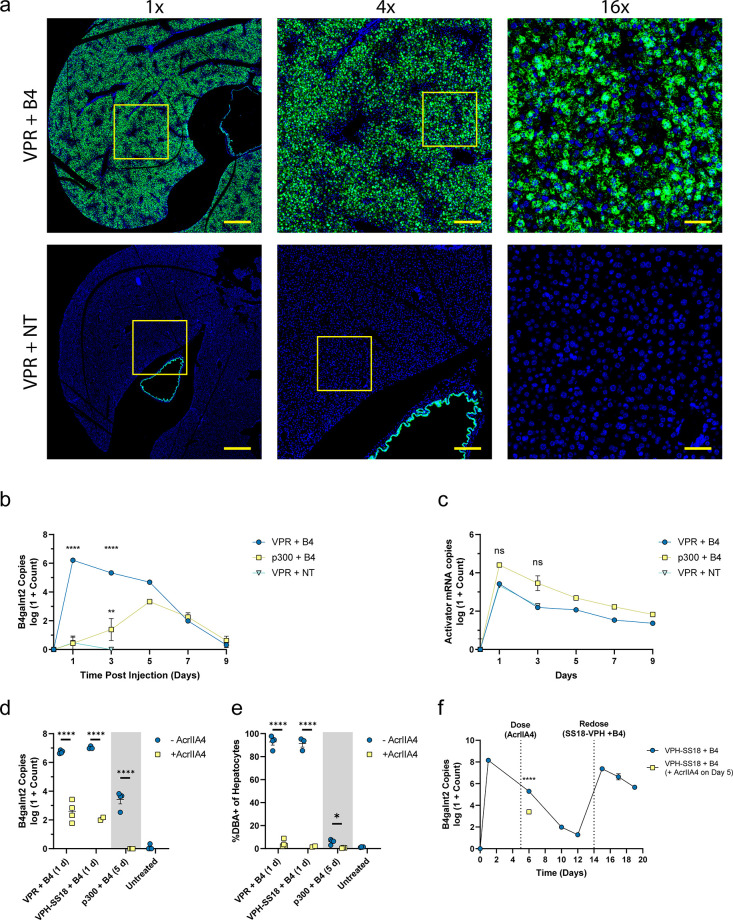
Figure 3.
In vivo demonstration of optimized B4galnt2 gene activation. (a) Representative slide scan images of liver sections showing RNAscope staining for B4galnt2 mRNA (green) and DAPI (blue). Insets depict the relative locations of 4× and 16× views. Scale bars are 800 μm for 1×, 200 μm for 4×, and 50 μm for 16× images. Time courses of B4galnt2 mRNA (b) and activator mRNA (c) copy numbers from liver tissue over 9 days. B4galnt2 mRNA copy numbers (d) and percentage of activated hepatocytes (e) in mice treated with activator mRNA and B4 sgRNA with or without AcrIIA4 co-delivery. The “–AcrIIA4” groups were dosed with activator mRNA and B4 sgRNA on day 0. The “+AcrIIA4” groups were simultaneously dosed with activator mRNA, B4 sgRNA, and AcrIIA4 mRNA on day 0. All VPR and VPH-SS18-treated mice were euthanized at day 1 postinjection, and all p300-treated mice were euthanized at 5 days postinjection. (f) VPH-SS18 time course with redosing. VPH-SS18 mRNA and B4 sgRNAs were delivered to both groups on day 0. AcrIIA4 treatment was given to one group on day 5, followed by euthanasia on day 6. Remaining mice that did not receive AcrIIA4 mRNA were then redosed with VPH-SS18 mRNA and B4 sgRNAs on day 14. Data represent mean ± SEM (n = 3–4 mice). Statistical significance was assessed using a two-way ANOVA followed by Dunnett’s multiple comparison compared to the NT-treated group (b,c) and a student’s t test (d,e) (*P < 0.05, **P < 0.01, ***P < 0.001, ****P < 0.0001).

