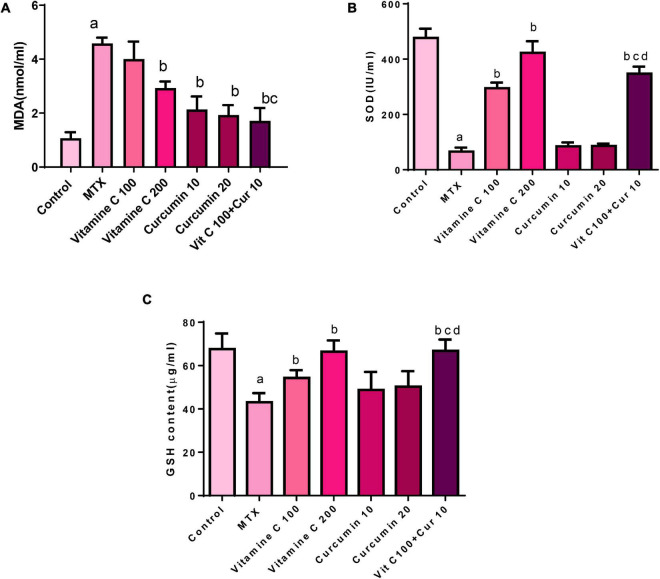
FIGURE 2.
Effects of vitamin C and curcumin pretreatment alone and in combination on (A) MDA tissue level, (B) SOD activity, and (C) GSH tissue level (a) MTX compared to the control P < 0.05, (b) vitamin C or curcumin compared to MTX P < 0.05, (b,c) combination VC and CUR compared to VC or CUR alone P < 0.05, (b–d) combination VC and CUR compared to VC or CUR alone P < 0.

