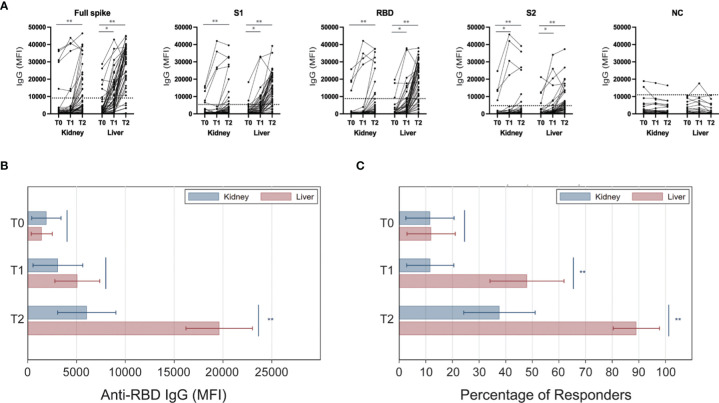
Figure 2.
Anti-viral IgG levels in kidney and liver transplant recipients after SARS-CoV-2 vaccination. Serum samples were collected at the time of the first (T0) and the second (T1) mRNA SARS-CoV-2 vaccine administration, and at 3 weeks after the second dose (T2). (A) Serological response of individual subjects against each of the tested viral antigens. Level considered positive is indicated by dotted horizontal lines for each antibody specificity. (B) Levels of IgG anti-RBD in kidney (blue) and liver (red) kidney transplant recipients at each time point. (C) Analyses shown in panel B were repeated after stratifying patients based on anti-RBD antibody response (MFI threshold for positivity: 8880). Horizontal lines represent 95 percent confidence intervals. *P < 0.05, **P < 0.01. MFI, Mean Fluorescence Intensity.

