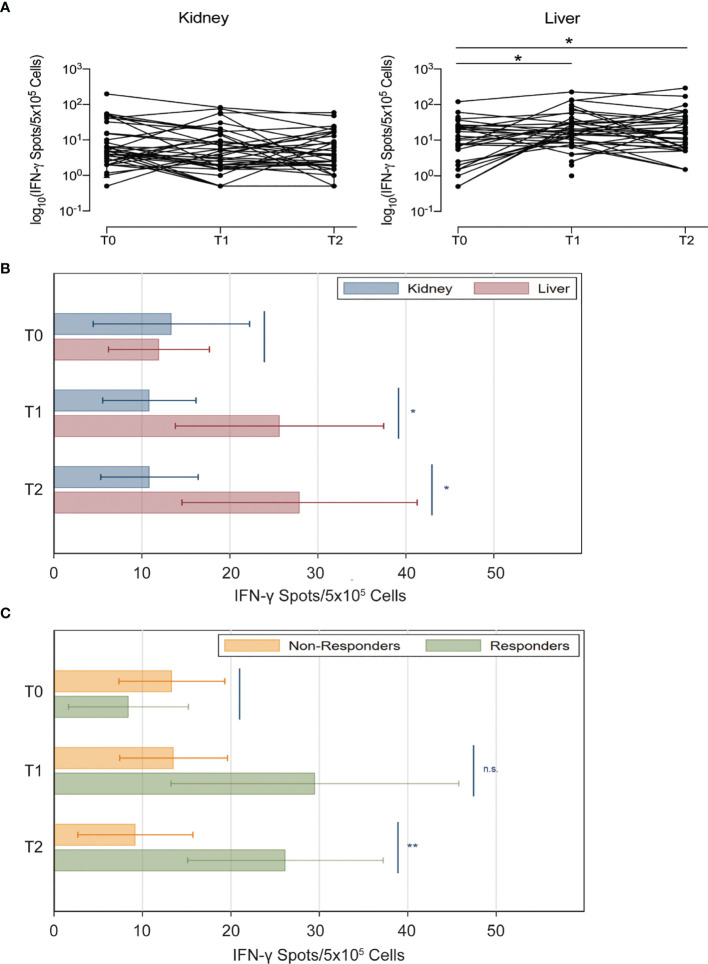
Figure 4.
Anti-spike IFN-γ+ T cell responses in kidney and liver transplant recipients after SARS-CoV-2 vaccination. (A) Anti-spike IFN-γ+ T cell spots of individual subjects (natural logarithmic scale). (B) Number of spots of anti-S IFN-γ FluoroSpot in kidney (blue) and liver (red) transplant recipients at each time point. (C) Analyses shown in panel B were repeated after stratifying patients based on anti-RBD antibody response (MFI threshold for positivity: 8880) (kidney and liver transplant recipients have been pooled together for this analysis). Horizontal lines represent 95 percent confidence intervals n.s., not significant; *P < 0.05, **P < 0.01.

