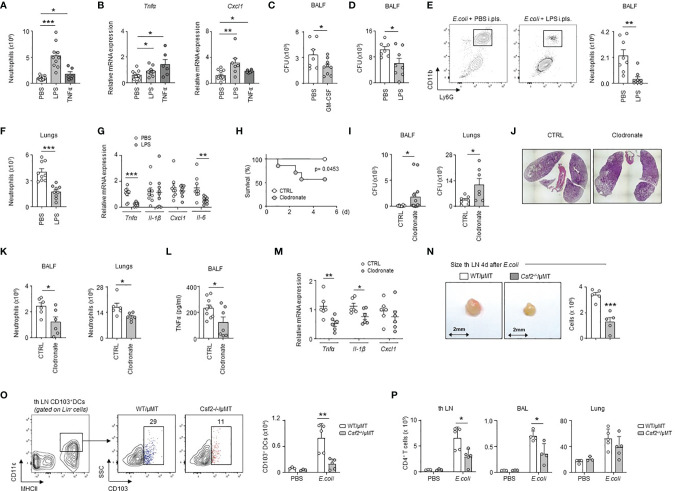
Figure 6.
PS cells enhance lung immunity upon bacterial airway infection. (A, B) Enumeration of neutrophils (A) and relative mRNA expression of Tnfα and Cxcl1 (B) in lungs 24h after i.pls. injection of PBS, 20µg of LPS or 100ng of TNFα (n=6-14 mice). (C) Number of CFU in BALF 6h after i.t. E. coli infection with (grey) or without (white) concomitant i.pls. injection of GM-CSF (n=7-9). (D–G) Mice were sacrificed 6h after i.t. E. coli infection with (grey) or without (white) concomitant i.pls. injection of LPS. (D) Number of CFU in BALF (n=9). (E, F) Enumeration of neutrophils in BALF (E) and lungs (F) (n=9). (G) Relative mRNA expression of Tnfα, Il-1β, Cxcl1 and Il-6 in lungs (n=8-9 mice). (H–M) Mice received i.pls. injection of liposome control (white) or clodronate (grey) and 2 days later they were intra-tracheally infected by E. coli (5x10⁶ CFU) during 5 days (H) or 24h (I–M). (H) Survival curve (n=7-8 mice/group). Data were analyzed by Log-rank (Mantel-Cox) test. (I) Number of CFU in BALF (n=12 mice) and lungs (n=7 mice) 24h post-infection. (J) Representative hematoxylin and eosin staining in lung sections 24h post-infection (n=4 mice). (K) Enumeration of neutrophils in BALF and lungs 24h post-infection (n=6 mice). (L) TNFα level in BALF 24h post-infection (n=7-9 mice). (M) Relative mRNA level expression of Tnfα, Il-1β, Cxcl1 in lungs 24h post-infection (n=6 mice). (N) Enumeration of cells in tracheobronchial lymph node of chimeric WT/µMT and Csf2-/-/µMT mice 4 days after i.t. E. coli infection (n=5). (O) Gating strategy and enumeration of CD103+ DCs in tracheobronchial lymph node of chimeric WT/µMT and Csf2-/-/µMT mice 4 days after i.t. E. coli infection (n=3-5). (P) Enumeration of CD4+ T cells in tracheobronchial lymph node, BAL and lung of chimeric WT/µMT and Csf2-/-/µMT mice 4 days after i.t. E. coli infection (n=3-5). (B, G, M) The expression level was arbitrarily set to 1 for one sample from the PBS/CTRL group, and the values for the other samples were calculated relatively to this reference. Data are pooled data from at least 2 independents experiments. Data represent mean ± S.E.M. and were analyzed by the two-tailed unpaired t-test. *p<0.05; **p<0.01; ***p<0.001.

