
Figure 2. Subgroup Analysis by Sex and Age.
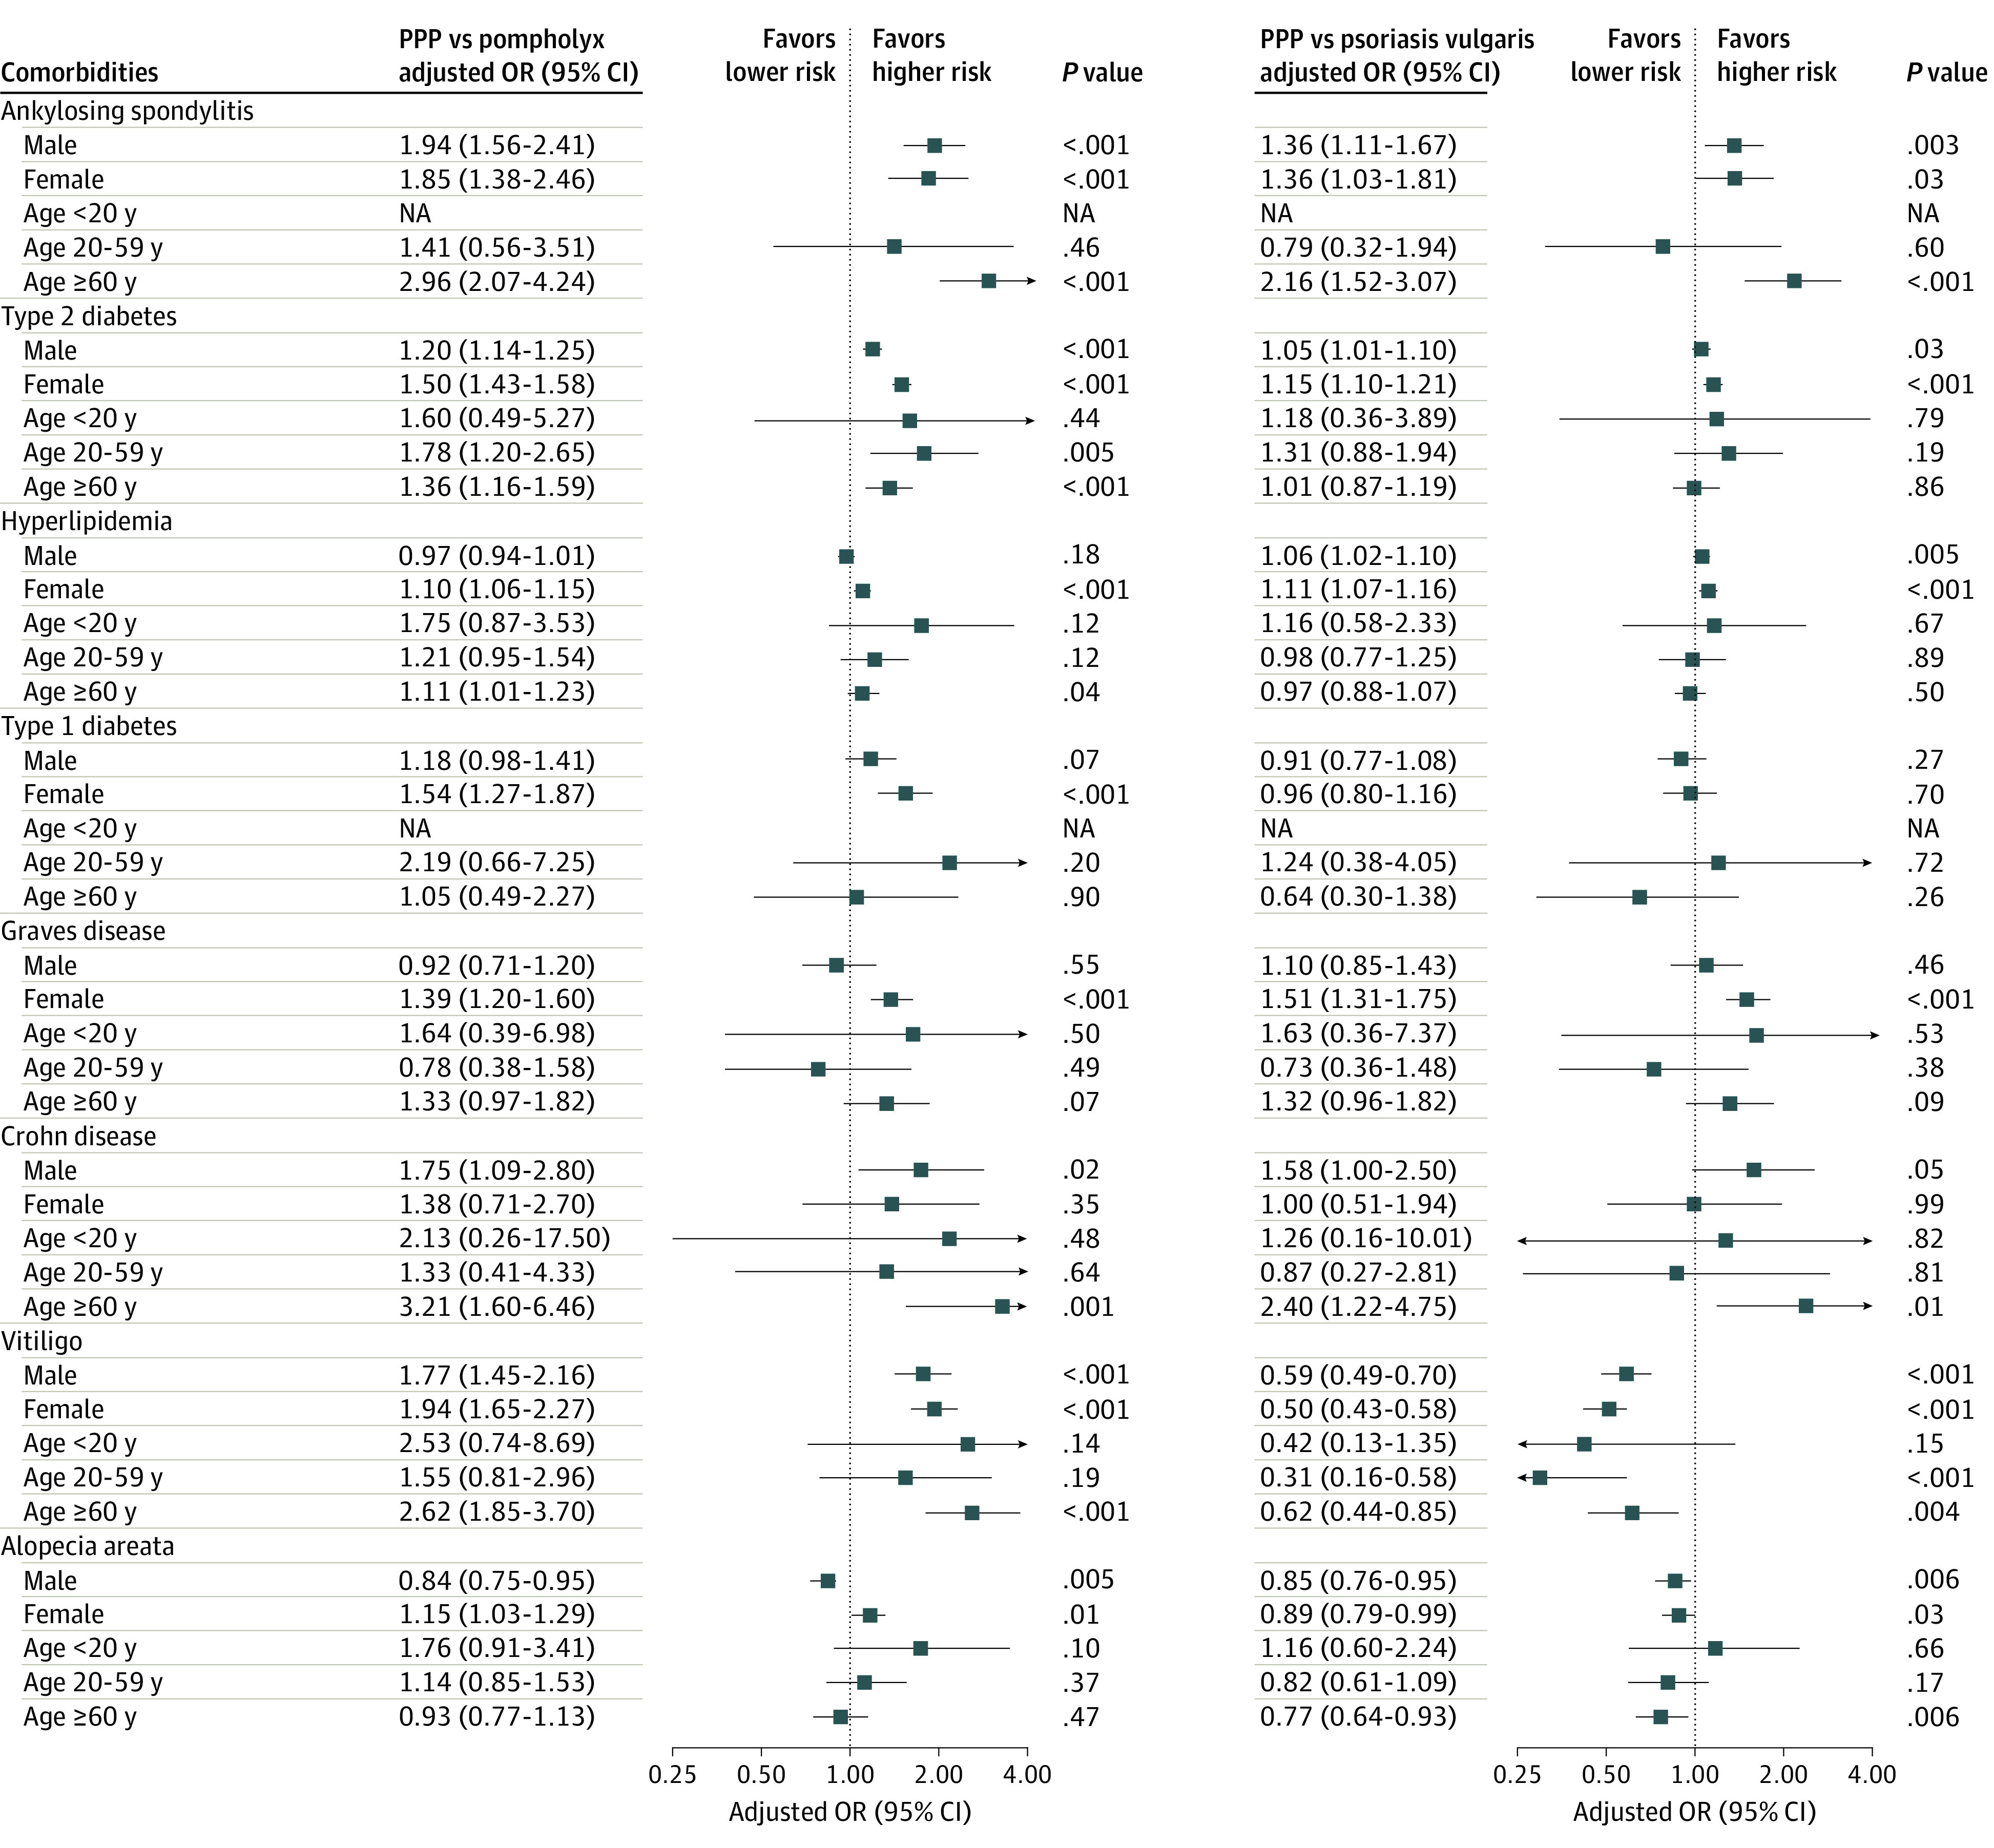
Adjusted odds ratios (ORs) were adjusted for demographic covariates (age, sex, region of residence, income, and insurance type). Outlier values over the range of plots were omitted. Arrows indicate 95% CI values that were beyond those shown on the x-axis. Not applicable (NA) indicates aOR could not be calculated because there was no patient in certain subgroups. PPP indicates palmoplantar pustulosis.