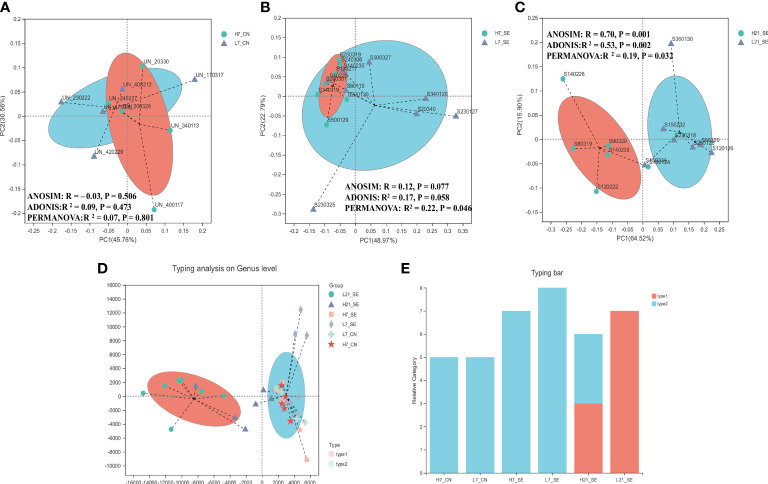
Figure 4.
Comparison analysis of cecum microbiota profile of non-infected SE-infected high and low H/L chickens. (A) Beta diversity, Principal coordinates analysis (PCoA) performed with weighted UniFrac distances showed no clear separation pattern between low and high H/L ratio non-infected chickens at 7 dpi. (B) Beta diversity, Principal coordinates analysis (PCoA) performed with weighted UniFrac distances showed no clear separation pattern between low and high H/L ratio SE-infected chickens at 7 dpi. (C) beta diversity, Principal coordinates analysis (PCoA) performed with weighted UniFrac distances showed more visible separation of clustering pattern between low and high H/L ratio SE-infected chickens at 21 dpi. (D) Typing analysis on genus level showing samples clustering according dominant species. (E) Bar typing analysis showing distribution of dominant species among groups. H7_CN: high H/L non-infected 7 dpi (n = 5); L7_CN: low H/L non-infected 7 dpi (n = 5); H7_SE: High H/L SE-infected 7 dpi (n = 8); L7_SE: Low H/L SE-infected 7 dpi (n = 7); H21_SE: high H/L SE-infected 21 dpi (n = 6); L21_SE: Low H/L SE-infected 21 dpi (n = 7).

