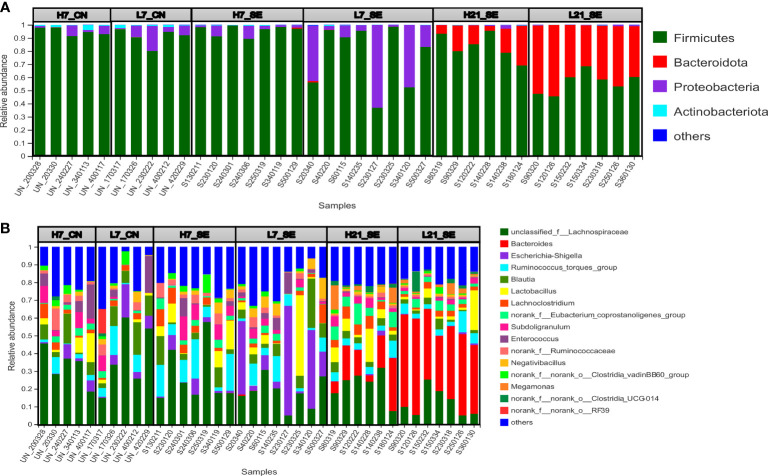
Figure 5.
Relative abundance of cecal microbiota phyla and genera of high and low H/L ratio SE-infected chickens at 7 and 21 dpi, by 16s profiling. (A) Relative abundance at phylum level. (B) Relative abundance at genus levels. H7_CN: high H/L non-infected 7 dpi (n = 5); L7_CN: low H/L non-infected 7 dpi (n = 5); H7_SE: High H/L SE-infected 7 dpi (n = 8); L7_SE: Low H/L SE-infected 7 dpi (n = 7); H21_SE: high H/L SE-infected 21 dpi (n = 6); L21_SE: Low H/L SE-infected 21 dpi (n = 7).

