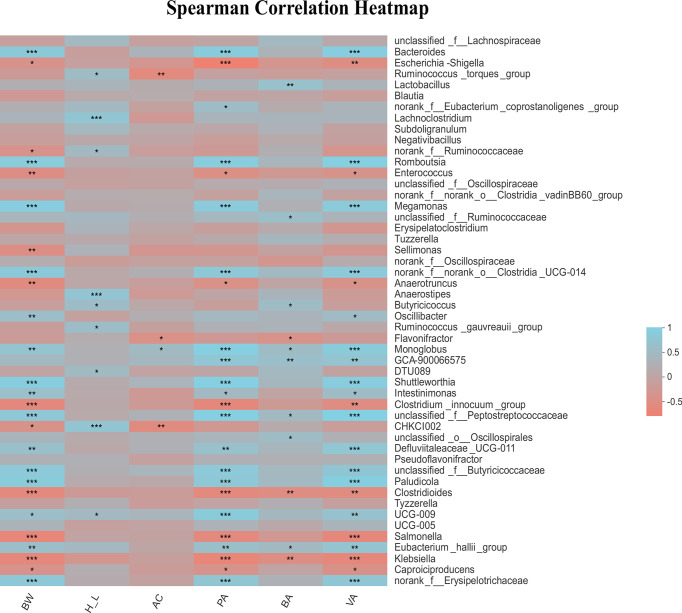
Figure 7.
Correlation of cecal microbiota genus with body weight post-infection, H/L ratio and SCFAs concentration in the caecum of SE-infected chickens at 7 and 21 dpi. Turquoise positive correlation; Salmon, negative correlation; *strong correlation (|R| > 0.55, p < 0.05). BW: body weight post-infection; H_L: heterophil/lymphocyte ratio; AC: acetate; PA: propionate; BA: butyrate; VA: valerate. In total 28 biological replicates were used to perform this analysis, including H7_SE: High H/L SE-infected 7 dpi (n = 8), L7_SE: Low H/L SE-infected 7 dpi (n = 7), H21_SE: high H/L SE-infected 21 dpi (n = 6) and L21_SE: Low H/L SE-infected 21 dpi (n = 7). *0.01 < P ≤ 0.05, **0.001 < P ≤ 0.01, ***P ≤ 0.001.

