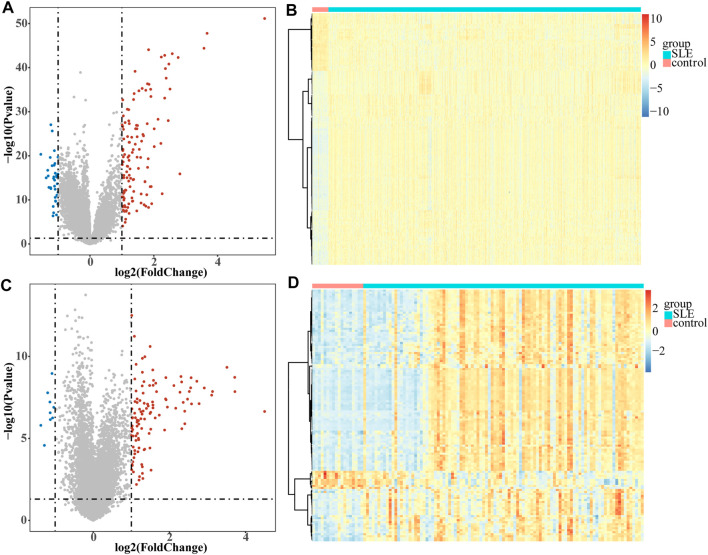
FIGURE1.
Volcano plots and heatmaps of DEGs. Each colored dot represents a DEG (|log2FC| >1 and p-value < 0.05). The blue dots represent the downregulated genes and the red dots represent the up-regulated genes. (A) Volcano map of the 161 EDGs identified in GSE65391. (B) Heatmap of the 161 EDGs identified in GSE65391. (C) Volcano map of the 125 EDGs identified in GSE72509. (D) Heatmap of the 125 EDGs identified in GSE72509.

