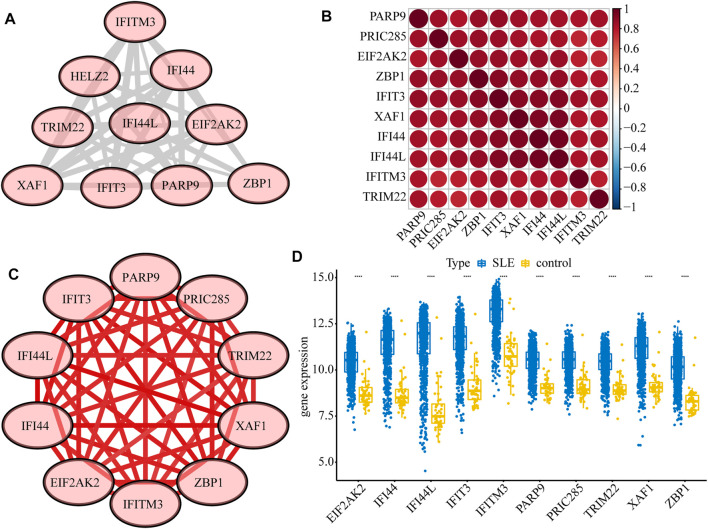
FIGURE 3.
Interactions among the ten diagnostic biomarkers. (A) The PPI network of the ten biomarkers. (B) The correlation heatmap of the ten biomarkers. (C) The correlation network of the ten biomarkers. (D) The boxplot of the expression levels of ten biomarkers validated in GSE39088.

