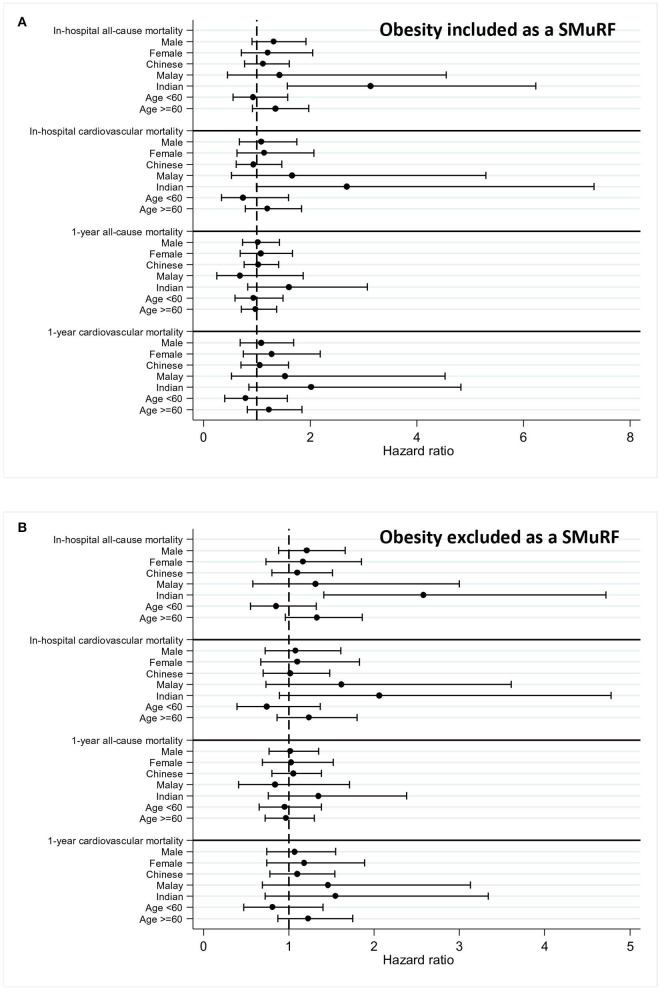
Figure 3.
Forest plot for an adjusted hazard ratio of mortality within subgroups. Adjusted hazard ratios of mortalities within subgroups (men, women, Chinese, Malay, South Asian, and age) were calculated and plotted in forest plots for patients with myocardial infarction (MI) with 95% confidence intervals (CI). Obesity was included (A) or excluded (B) as a SMuRF for the analysis.

