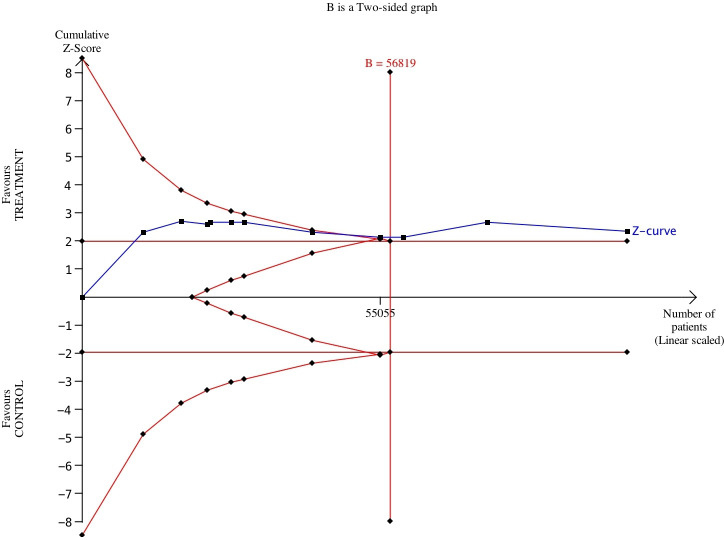
Figure 3.
Trial-sequential analysis of 11 RCTs comparing PUFAs vs no treatment or placebo for preventing cardiovascular death. The expected RRR was assumed to be 10%. in the Z-curve (blue line), Individual trials correspond to individual segments; trials are plotted in chronological order (from left to right). The x-axis indicates the cumulative number of patients. Red lines are the boundaries for superiority or inferiority; B, sample size or cumulative number of patients.

