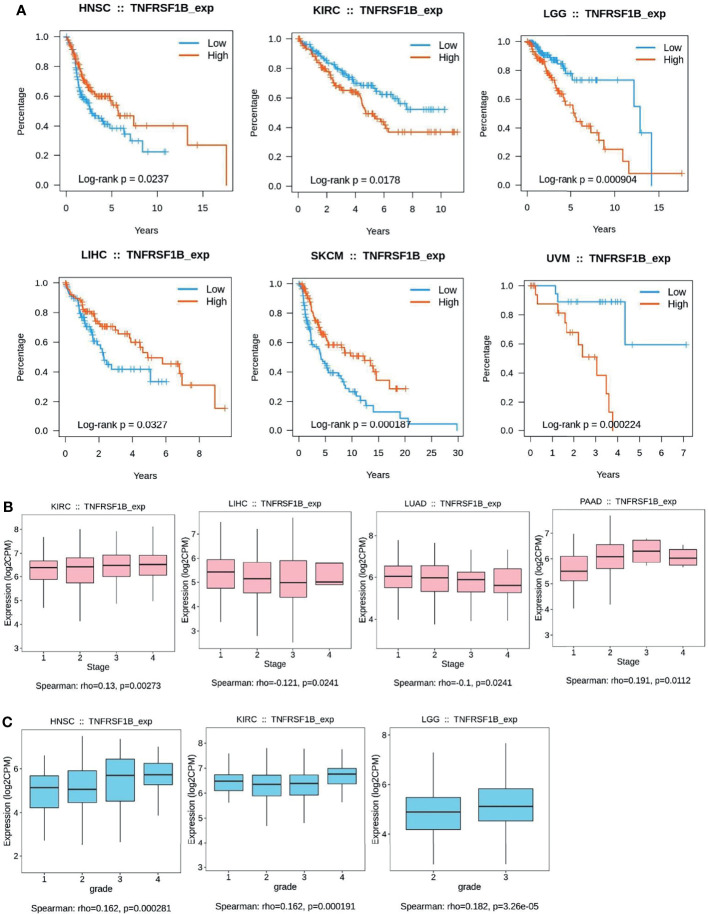
Figure 3.
Kaplan–Meier curves to demonstrate the clinic pathological significance of TNFR2. (A) Analysis of the relationship between the expression of TNFR2 and the overall survival (OS) of various cancer patients from TCGA database through TISIDB (P < 0.05). (B, C) Analysis of the relationship between TNFR2 expression and tumor stage and grade through TIBIS prediction (P < 0.05).

