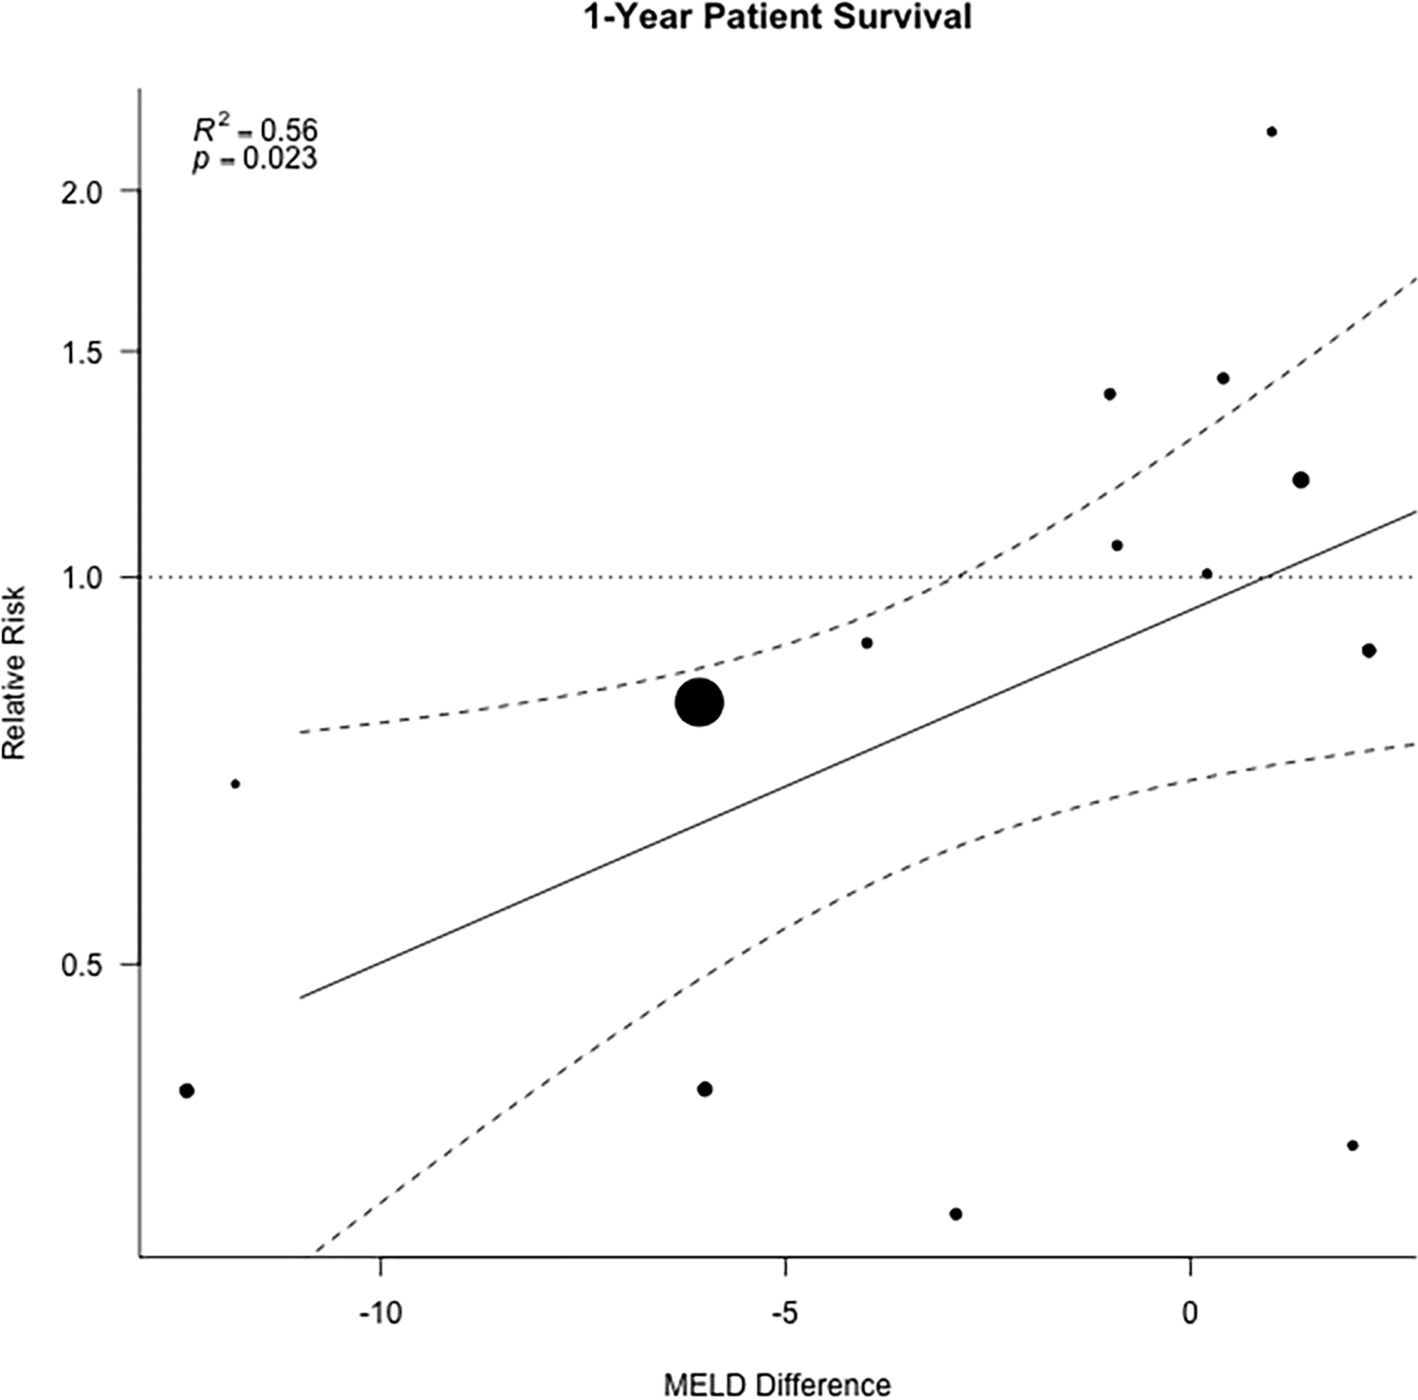
Figure 6. Random effects meta-regression.

showing how results of meta-analysis examining 1-year patient survival are influenced by the difference in MELD score between LDLT and DDLT. Each dot represents an individual study, the solid line represents the regression prediction, and the dotted lines the 95% Confidence intervals.
