Figure 3.

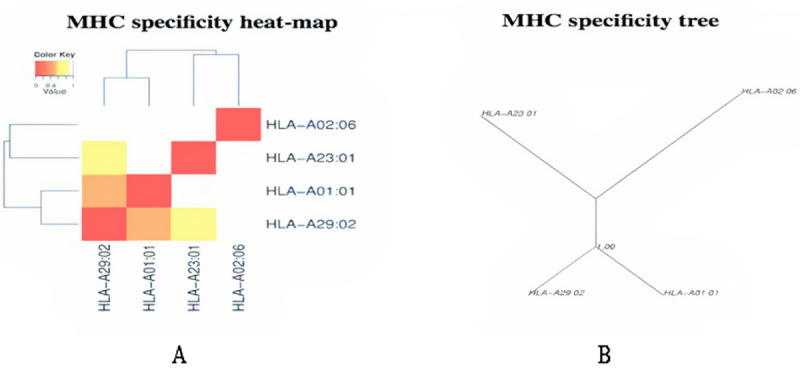
Major histocompatibility complex (MHC) class cluster analysis. (A) Heat map. (B) Specificity tree. The red zone indicates a strong interaction and the yellow zone corresponds to a weaker interaction.

Major histocompatibility complex (MHC) class cluster analysis. (A) Heat map. (B) Specificity tree. The red zone indicates a strong interaction and the yellow zone corresponds to a weaker interaction.