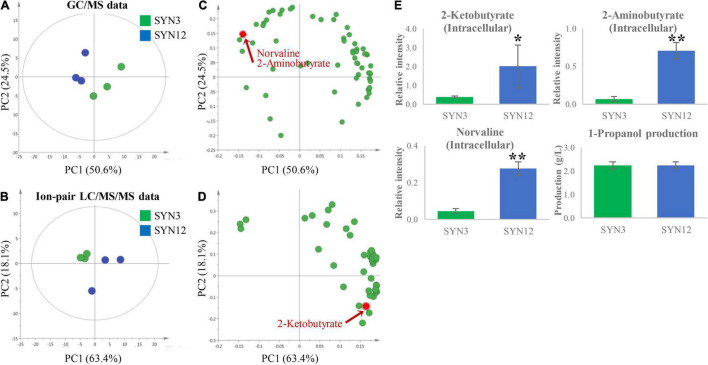
FIGURE 2.
PCA analysis of SYN3 and SYN12. The score plot derived from autoscaled (A) GC/MS data. (B) Ion-pair LC/MS/MS data. The corresponding loading plot illustrating metabolites that contributed to the separation on PC1 and PC2 derived from autoscaled. (C) GC/MS data. (D) Ion-pair LC/MS/MS data. All metabolites contribution is shown in Supplementary Figure 1. (E) The result of intracellular key intermediate, by-products and 1-propanol production. Metabolite intensities shown in the y-axis were normalized to an internal standard. Asterisks indicate significant difference from the strain (*p < 0.05, **p < 0.01). The error bars indicate standard deviations obtained from three replicate fermentations.

