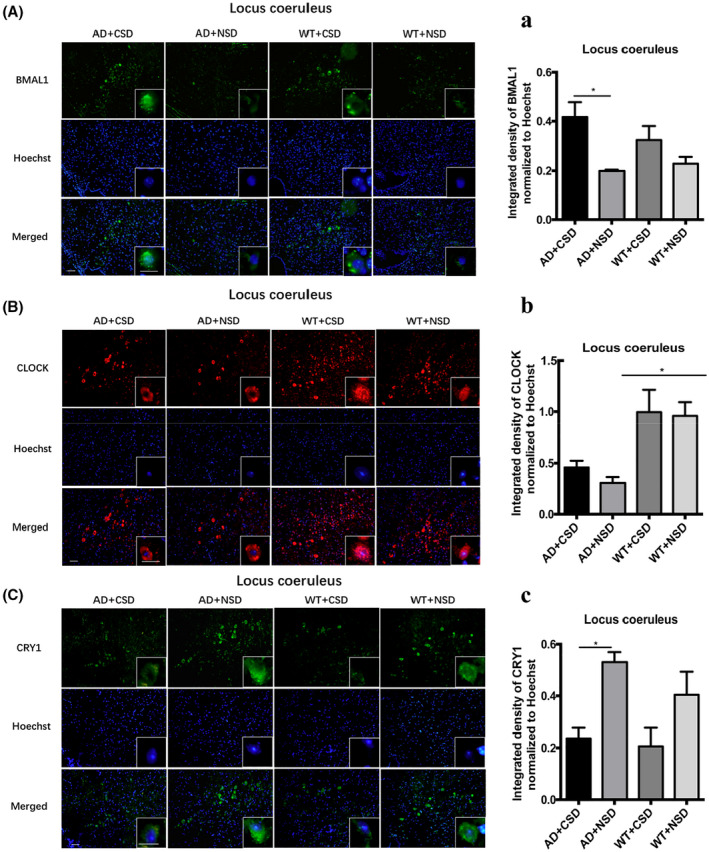
FIGURE 5.

Immunofluorescent staining of BMAL1, CLOCK, and CRY1 in LC of 6–6.5 months old mice after CSD. The BMAL1 staining in mouse LC after CSD (A). Integrated density of BMAL1 staining normalized to Hoechst staining was analyzed, n = 4 mice in each group (a). The CLOCK staining in mouse LC after CSD (B). Integrated density of CLOCK staining normalized to Hoechst staining was analyzed, n = 4 mice in each group (b). The CRY1 staining in mouse LC after CSD (C). Integrated density of CRY1 staining normalized to Hoechst staining was analyzed, n = 4 mice in each group (c). Left scale bar: 50μm, right scale bar: 20μm. Data were the mean ± SEM values. *p < 0.05, by two‐way ANOVA with Tukey's multiple comparisons test.
