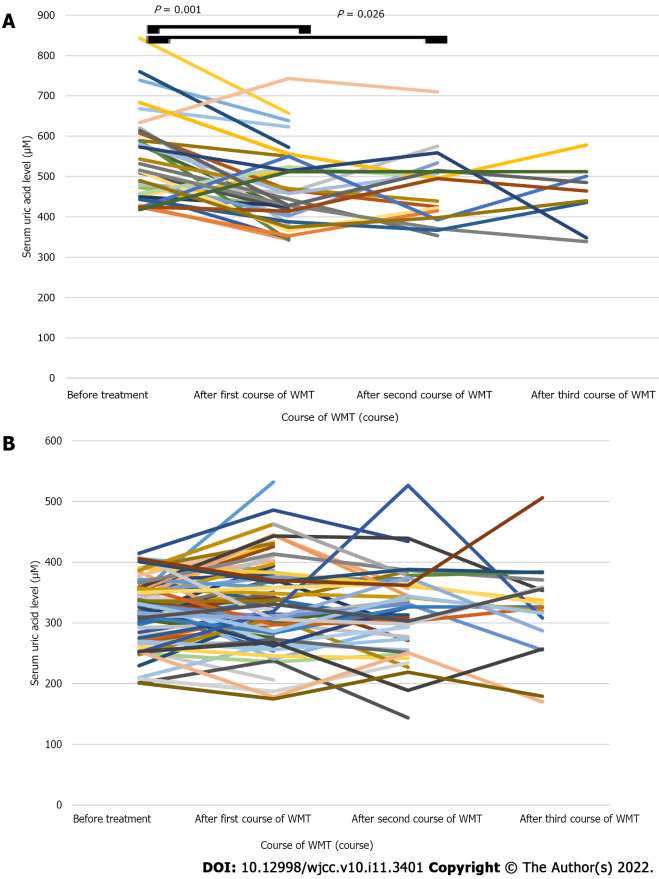
Figure 5.
Changes in the serum uric acid level before and after different courses of washed microbiota transplantation. A: Hyperuricaemia group (n = 44). After the first course of washed microbiota transplantation (WMT) and before treatment: 469.74 ± 97.68 vs 540.00 ± 107.16, P = 0.001. After the second course of WMT and before treatment: 465.57 ± 88.88 vs 513.19 ± 78.14, P = 0.026. After the third course of WMT and before treatment: 417.36 ± 92.84 vs 526.73 ± 111.30, P = 0.101; B: Normal uric acid group (n = 100). After the first course of WMT and before treatment: 328.86 ± 71.91 vs 320.55 ± 52.73, P = 0.184. After the second course of WMT and before treatment: 323.18 ± 68.06 vs 317.29 ± 57.44, P = 0.442. After the third course of WMT and before treatment: 328.59 ± 73.52 vs 333 ± 55.49, P = 0.628. WMT: Washed microbiota transplantation.

