. 2020 Jan 10;10(4):2241–2253. doi: 10.1039/c9ra08508d

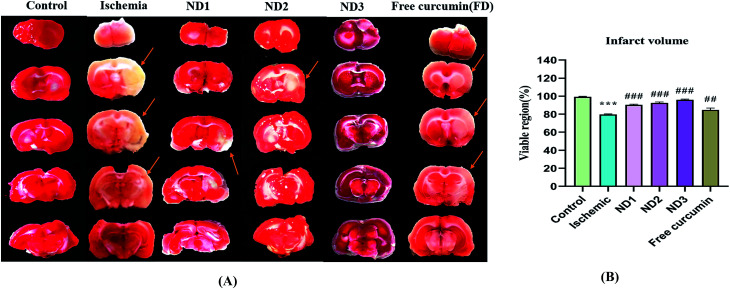
Fig. 6. (A) Photographs showing effect of collagen–curcumin nanocomposite on brain infarct in control (N), ischemic (I), ND1 (1 μg per kg b. wt), ND2 (10 μg per kg b. wt), ND3 (100 μg per kg b. wt) and free curcumin (FD) (100 μg per kg b. wt) resp. Infarct region is very well visible in ischemic group (I) brain sections as compared to control (N) group brain sections and all the three treatment groups showed a significant reduction in infarct region in comparison to free curcumin group. (B) Shows quantification of infarct analysis. Values are expressed as mean ± S.E.M. Results on comparison with the control group shows a significant difference (***p < 0.001). Results obtained shows significant difference from ischemic group (#p < 0.05, ###p < 0.001).

Fig. 6