. 2020 Jan 10;10(4):2241–2253. doi: 10.1039/c9ra08508d

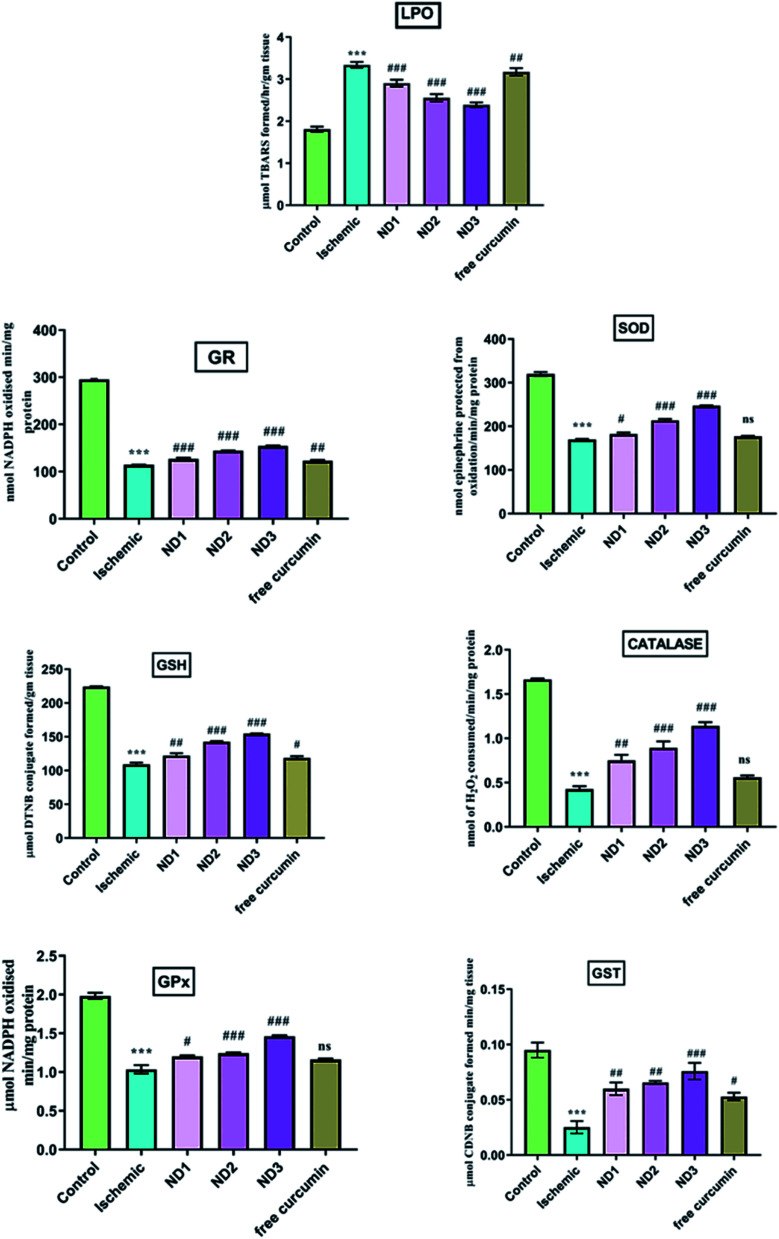
Fig. 7. Effect of collagen–curcumin nanocomposite on various biochemical markers like LPO, SOD, GSH, GPX, GST, CATGR. Groups shown are control (N), ischemic (I), ND1 (1 μg per kg b. wt), ND2 (10 μg per kg b. wt), ND3 (100 μg per kg b. wt) and free curcumin (FD) (100 μg per kg b. wt). A significant increase in LPO content and decrease in other anti-oxidant marker content can be seen in ischemic (I) group in comparison to control (N) group. Treatment with ND3 restored the marker content significantly. Results are shown as mean ± S.E.M. Results on comparison with control group shows significant difference (***p < 0.001). Results obtained shows significant difference from ischemic group (#p < 0.05, ##p < 0.01, ###p < 0.001 and ns p > 0.05).

Fig. 7