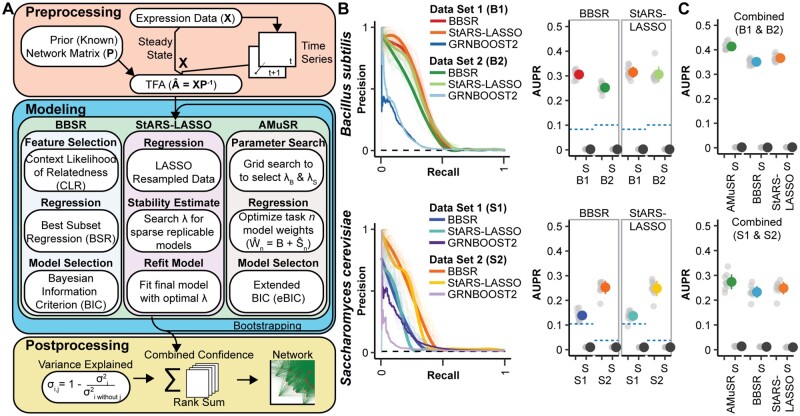
Fig. 2.
Network inference performance on multiple model organism datasets. (A) Schematic of Inferelator workflow and a brief summary of the differences between GRN model selection methods. (B) Results from 10 replicates of GRN inference for each modeling method on (i) B.subtilis GSE67023 (B1), GSE27219 (B2) and (ii) S.cerevisiae GSE142864 (S1), and Tchourine et al. (2018) (S2). Precision–recall curves are shown for replicates where 20% of genes are held out of the prior and used for evaluation, with a smoothed consensus curve. The black dashed line on the precision–recall curve is the expected random performance based on random sampling from the gold standard. AUPR is plotted for each cross-validation result in gray, with mean ± standard deviation in color. Experiments labeled with (S) are shuffled controls, where the labels on the prior adjacency matrix have been randomly shuffled. A total of 10 shuffled replicates are shown as gray dots, with mean ± standard deviation in black. The blue dashed line is the performance of the GRNBOOST2 network inference algorithm, which does not use prior network information, scored against the entire gold standard network. (C) Results from 10 replicates of GRN inference using two datasets as two network inference tasks on (i) B.subtilis and (ii) S.cerevisiae. AMuSR is a multi-task-learning method; BBSR and StARS-LASSO are run on each task separately and then combined into a unified GRN. AUPR is plotted as in (B)

