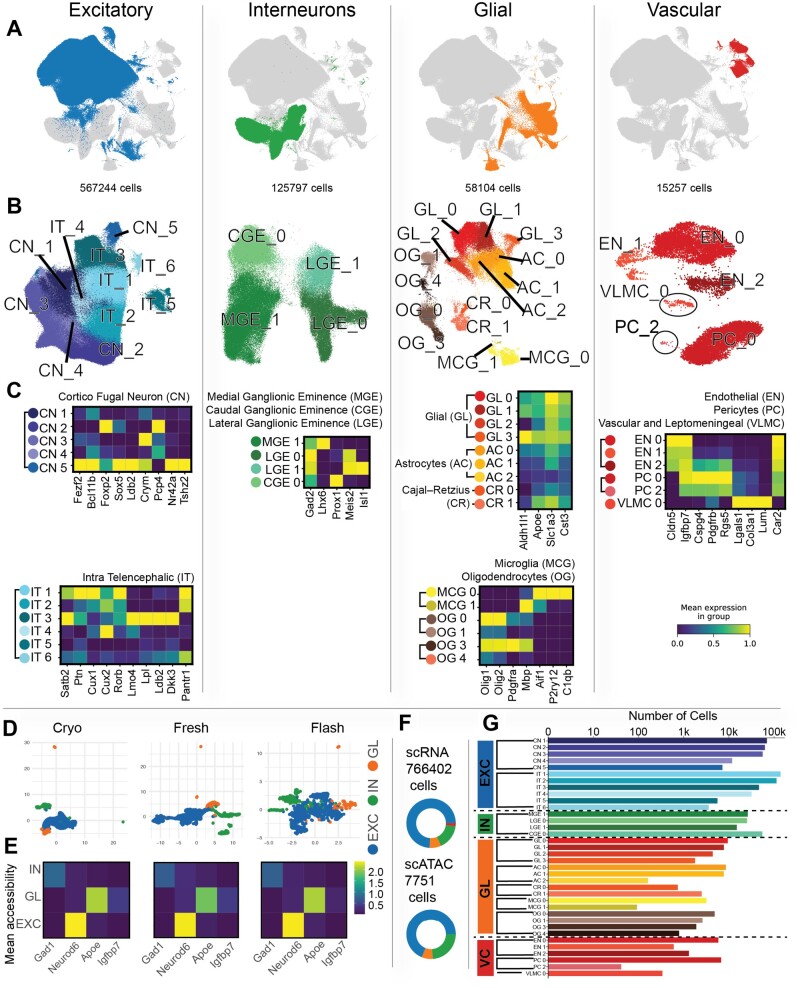
Fig. 5.
Processing large single-cell mouse brain data for network inference (A) Uniform Manifold Approximation and Projection plot of all mouse brain scRNAseq data with excitatory neurons, interneurons, glial cells and vascular cells colored. (B) Uniform Manifold Approximation and Projection plot of cells from each broad category colored by Louvain clusters and labeled by cell type. (C) Heatmap of normalized gene expression for marker genes that distinguish cluster cell types within broad categories. (D) Uniform Manifold Approximation and Projection plot of mouse brain scATAC data with excitatory neurons, interneurons and glial cells colored. (E) Heatmap of normalized mean gene accessibility for marker genes that distinguish broad categories of cells. (F) The number of scRNAseq and scATAC cells in each of the broad categories. (G) The number of scRNAseq cells in each cell-type-specific cluster

