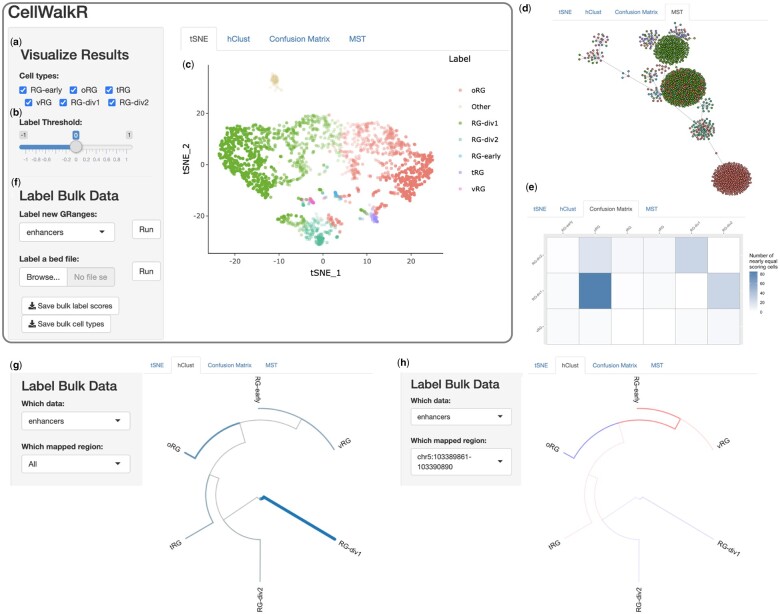
Fig. 1.
Overview of CellWalkR interface. CellWalkR provides an interactive interface for downstream analysis and visualization of influence matrices. The user selects (a) their cell types of interest and (b) the label threshold, and CellWalkR dynamically generates (c) a t-SNE embedding and (d) an MST of cell-to-cell influence, and (e) a confusion matrix counting how many cells have very similar label scores. The user can then calculate cell type-specific labels for bulk data (f) either from their active session or from a BED format file. After bulk data are selected, new menu options are displayed for analyzing labels, allowing the user to (g) view enrichment for cell types across all bulk data in a hierarchical clustering of cell types, and (h) examine how a specific range is enriched or depleted in each cell type. Shown data are for cell type labels (Nowakowski et al., 2017) and scATAC-seq from a population of radial glia in the developing brain (Ziffra et al., 2021). RG, Radial Glia; oRG, outer RG; tRG, truncated RG and vRG, ventral RG

