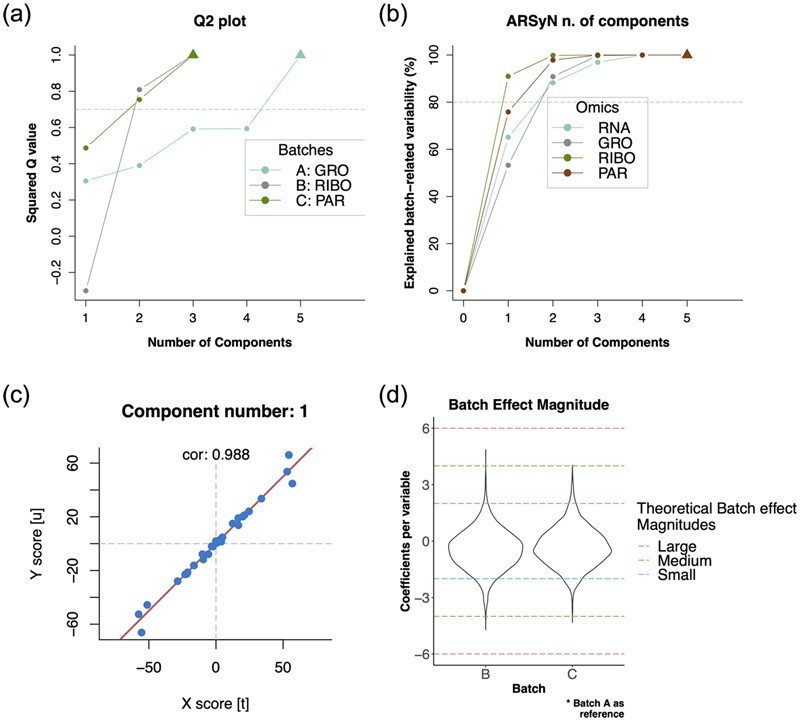
Fig. 2.

Usage of MultiBaC method on the complete yeast multiomics dataset. (a) Q2 plot shows the number of PLS components needed to reach a good predictive ability. (b) Explained variance plot shows the number of components retained by the ARSyN model. (c) Inner relation plot checks the requirement of linearity between X and Y PLS components. (d) Distribution of the magnitude of batch effects
