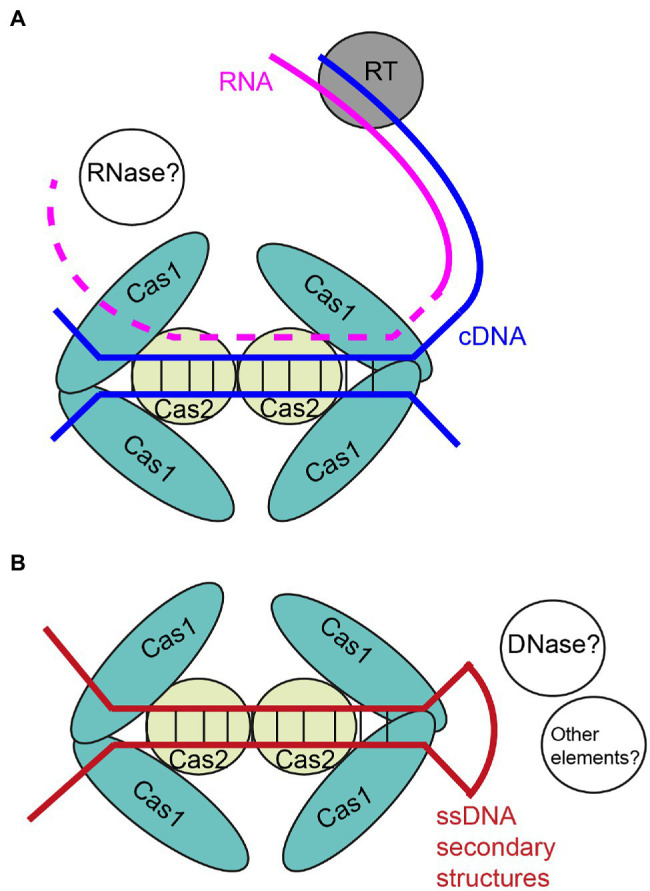
Figure 1.

Diagrams of unique type III adaptation preference with (A) and without (B) reverse transcriptase activity. (A) RT represents reverse transcriptase, which is usually fused with Cas1–Cas2 complex, and may also be independent as well. Complementary DNA (cDNA) is depicted by blue. RNA template is depicted by pink, and the dashed lines represents potential digestion against the RNA template. (B) Single-stranded DNA (ssDNA) secondary structure is depicted by red. Hypothetical proteins or other elements are presented by white balls.
