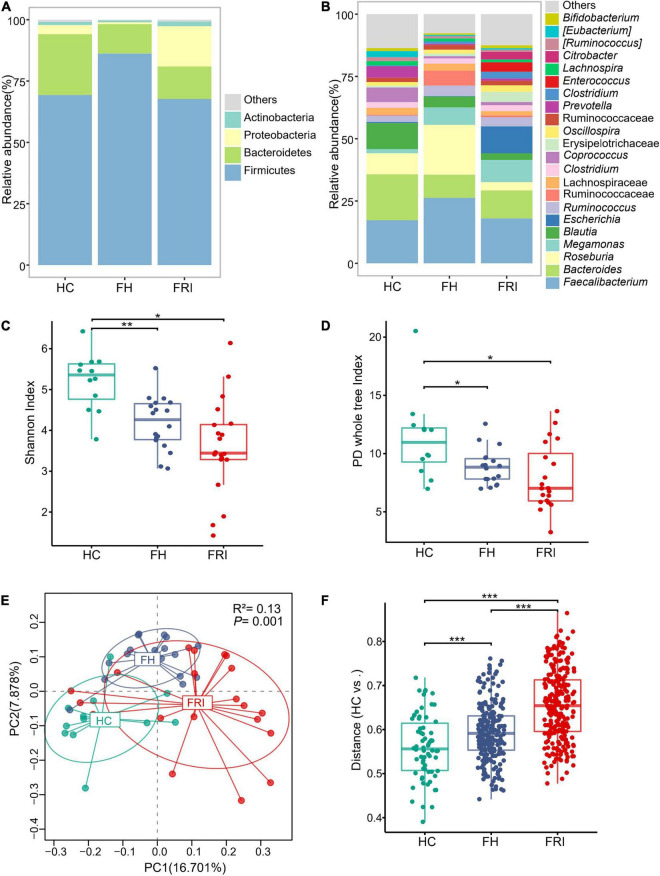
FIGURE 1.
The gut microbiota composition in fracture-related infection (FRI), fracture healed (FH), and healthy controls (HC) groups. (A) Taxonomy composition at the phylum level. (B) Taxonomy composition at the genus level. (C) α Diversity indicted by Shannon’s diversity index. (D) α Diversity indicated by PD whole tree index. (E) Principal coordinate analysis (PCoA) based on Unweighted UniFrac distance. (F) Comparisons of β diversity indicated by Unweighted UniFrac distance between samples in HC group and each group. “Others” represents lower-abundance taxa. *P < 0.05, **P < 0.01, and ***P < 0.001.

