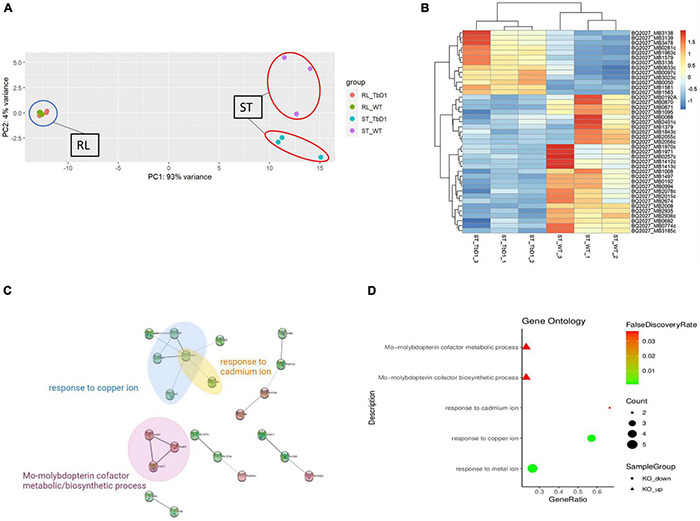
FIGURE 3.

Comparative transcriptome analysis of M. bovis AF2122/97 WT and ΔTbD1 under standing growth condition and rolling growth condition. (A) Principal-component analysis (PCA) of the WT and ΔTbD1 M. bovis AF2122/97 transcriptomes from two different culture conditions: blue circle indicates the rolling condition and red circles indicate the standing condition. Each point represents a strain sample as indicated in the legend on the right. (B) Hierarchical clustering-heatmap of the 41 differentially expressed genes in M. bovis AF2122/97 ΔTbD1. Upregulated expression is presented in red and downregulated expression is presented in blue. Each row represents a gene, and each column represents a strain sample. (C) Protein–protein interaction network of the differentially expressed genes. Red nodes represent upregulated genes, while green nodes represent downregulated genes. The edges indicate the association between genes and edge width indicates the score of confidence of an interaction on the available evidence from STRING (the wider the edge, the higher scores of the interaction). (D) Gene ontology (GO) enrichment analysis for differentially expressed genes in M. bovis AF2122/97 ΔTbD1 grown in standing conditions. The GO enrichment terms from enrichment analysis of the upregulated (triangle) and downregulated (circle) genes are presented. The gene ratio refers to the ratio of the number of genes in the GO entry following enrichment to the total number of genes in the GO entry. An increased gene ratio indicates greater enrichment. Lower false discovery rate indicates higher significance.
