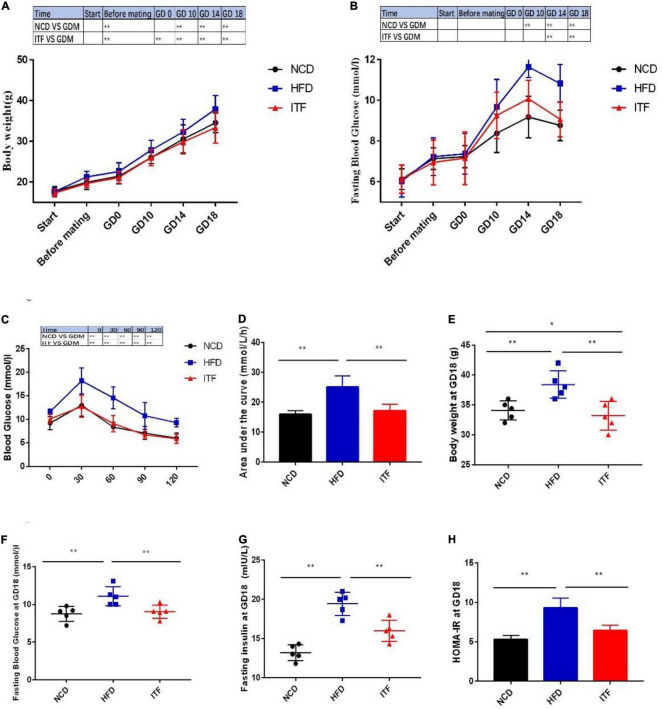
FIGURE 1.
Improvement in metabolic parameters in HFD-induced gestational diabetes mice by ITF. (A) Body weight. (B) FBG. (C) Plasma glucose profile. (D) Mean AUC measured during the OGTT. (E) Body weight at GD18. (F) FBG at GD18. (G) Fasting insulin at GD18. (H) HOMA-IR at GD18. AUC, area under the curve; OGTT, oral glucose tolerance test. Data are presented as mean ± SEM. Data were analyzed using two-way ANOVA followed by the Bonferroni post hoc test for panels (A,B,F) and using one-way ANOVA followed by the Tukey post hoc test for panels (C–E,G). *p < 0.05, **p < 0.01.

