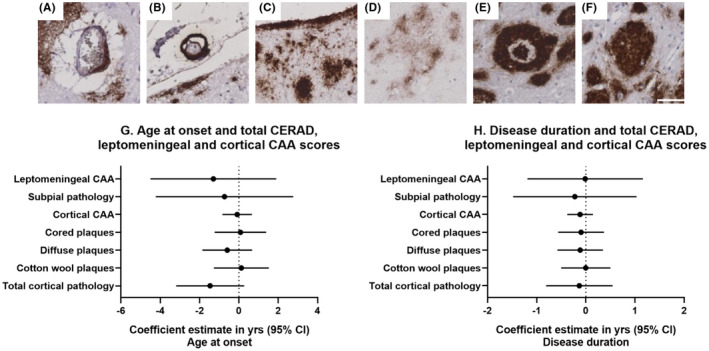
FIGURE 1.

Representative images of cortical and leptomeningeal CAA (A & B), subpial pathology (C) and of Aβ plaque types (D: diffuse, E: Cored, F: CWP). White scale bar =50um, 200x objective. Linear regression adjusted for APOE4 status showing the association between total Aβ pathology scores, leptomeningeal CAA, cortical CAA and age at onset (G) and disease duration (H). Coefficient estimates and 95% confidence intervals for the whole cohort are represented for each total Aβ pathology score and the leptomeningeal and cortical CAA scores.
