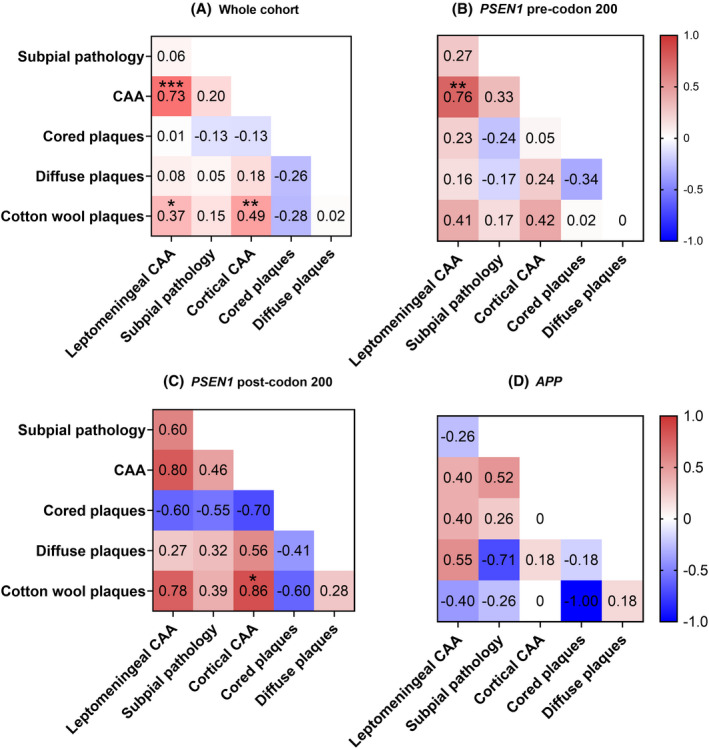
FIGURE 3.

Correlation between total Aβ pathologies, leptomeningeal and cortical CAA: heat maps showing the relationship between the total Aβ pathology scores, leptomeningeal and cortical CAA ‐ A) Whole cohort, B) PSEN1 pre‐codon 200, C) PSEN1 post‐codon 200, D) APP. τ b values for Kendall's tau‐b correlation coefficients are shown. Asterisks represent statistically significant correlations: *p < 0.05, **p < 0.01, ***p < 0.001. Red =positive correlation. Blue = negative correlation
