. 2020 Jan 21;10(6):3429–3437. doi: 10.1039/c9ra10660j

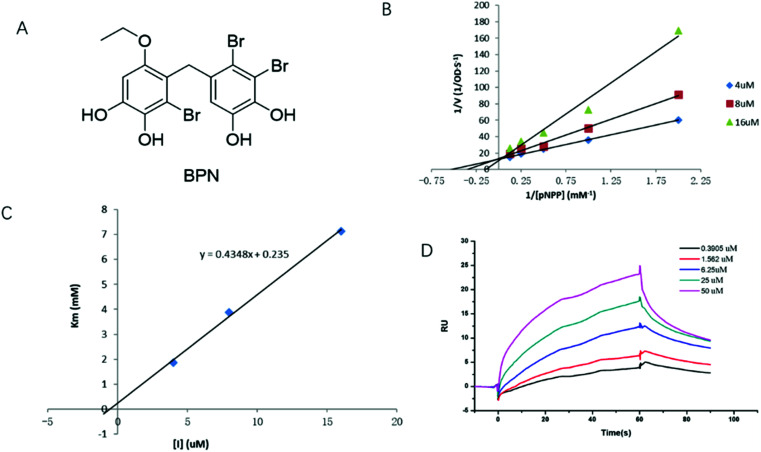
Fig. 1. BPN is a competitive PTP1B inhibitor. (A) Chemical structure of BPN. (B) The Lineweaver–Burk plot for inhibition of PTP1B enzyme reaction by BPN. The experiment was performed at 37 °C and pH 7.5. BPN concentrations were 4 (◆), 8 (■) and 16 μM (▲), respectively. (C) Ki determination for BPN. The plot of apparent Kmversus the concentrations of BPN. BPN concentrations were 4 (◆), 8 (■) and 16 μM (▲), respectively. (D) SPR dose–response curves of BPN. The Ka, Kd and KD values of BPN were 4.238 × 10³ Ms−1, 1.406 × 10⁻² s−1, 3.318 × 10⁻⁶ M, respectively. KD values of BPN was obtained by fitting the data sets to 1 : 1 binding model using Biacore T200 Evaluation Software.

Fig. 1