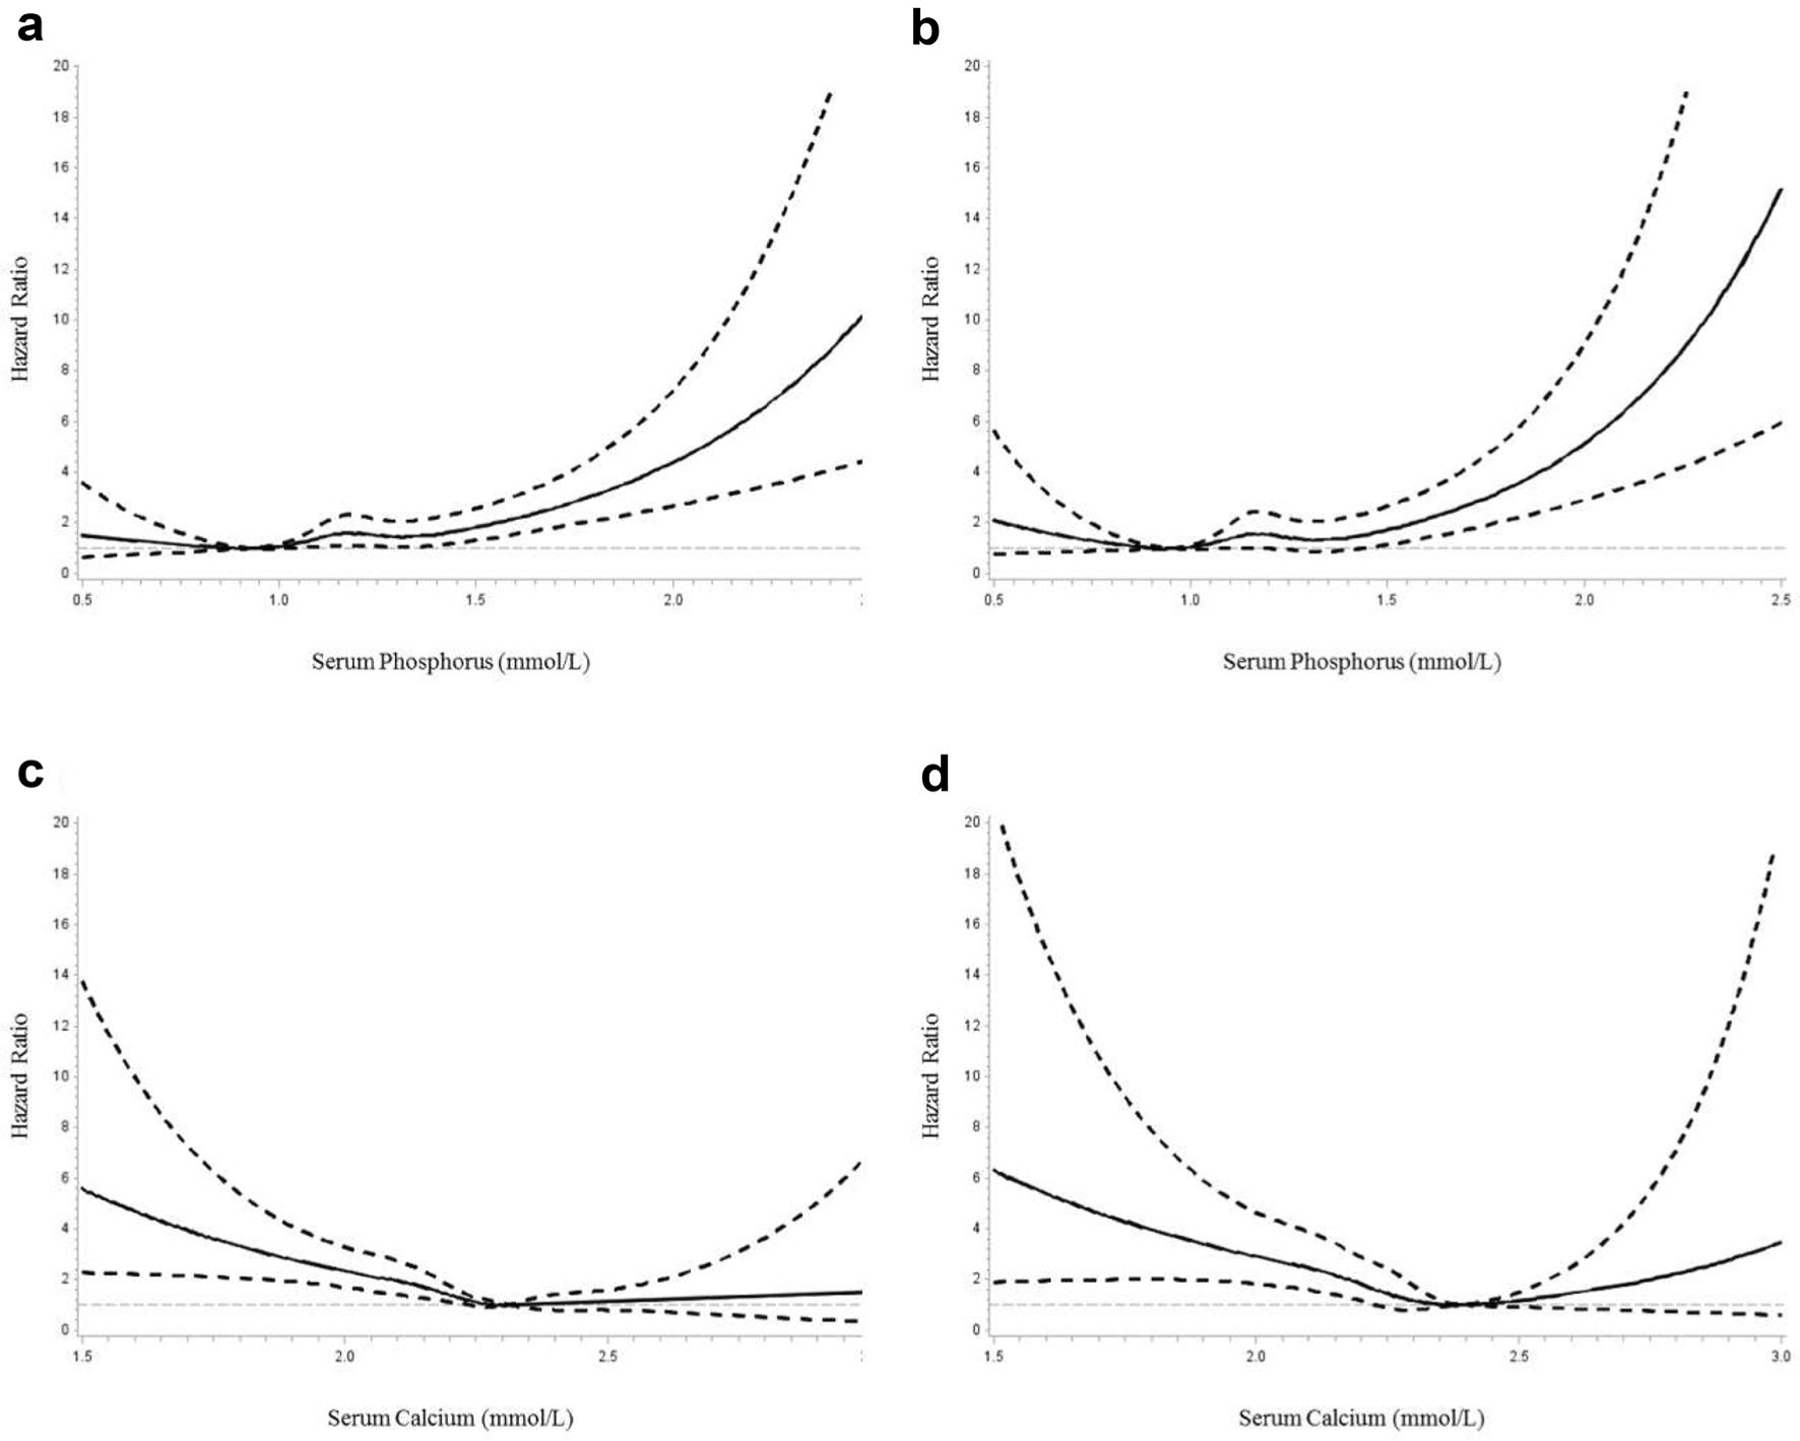
Fig. 1.

Spline plots displaying the risk of all-cause and cardiovascular mortality over the range of serum phosphorus and calcium. a HR for all-cause mortality by baseline serum phosphorus. b HR for cardiovascular mortality by baseline serum phosphorus. c HR for all-cause mortality by baseline serum calcium. d HR for cardiovascular mortality by baseline serum calcium. Adjusted for age, gender, body mass index, systolic blood pressure, high-density lipoprotein cholesterol, triglycerides, estimated glomerular filtration rate, history of diabetes, education, marriage, leisure-time physical activity, smoking, alcohol drinking, type of coronary heart disease, use of antihypertensive drugs, use of anti-diabetic drugs, use of lowering-lipid drugs and use of anti-platelet drugs. Dashed lines represented 95% CI
