Figure 2.
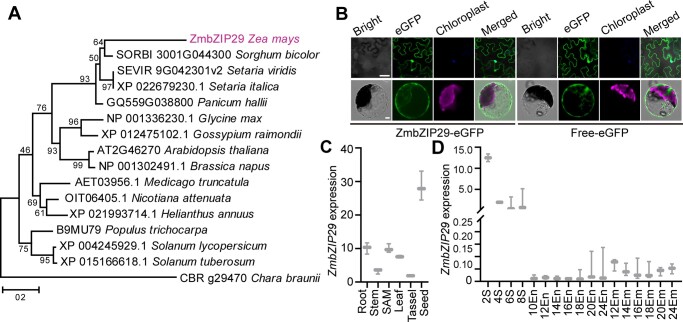
Phylogenetic analysis of ZmbZIP29 and expression pattern of ZmbZIP29. A, Phylogenetic tree of ZmbZIP29 (in purple) and its orthologs. The phylogenetic distance was evaluated using the neighbor-joining algorithm. The numbers at the nodes represent the percentage of 1,000 bootstraps. The C. braunii ortholog protein was used as an outgroup. Scale bar, the average number of amino acid substitutions per site. B, Subcellular localization of ZmbZIP29-eGFP in N. benthamiana leaves (top panel) and Arabidopsis leaf mesophyll protoplasts (bottom panel). Bars = 25 μm. C, RT-qPCR analysis of ZmbZIP29 expression in different tissues from the B104 inbred lines. The 4-DAP seeds were used for mRNA extraction. All expression levels were normalized to that of ZmActin. Error bars represent SD of three biological replicates. D, RT-qPCR analysis of ZmbZIP29 expression during seed development. The numbers under the x-axis indicate the DAP during seed development. S, seed; En, endosperm; Em, embryo. All expression levels were normalized to that of ZmActin. Error bars represent SD of three biological replicates.

