Figure 3.
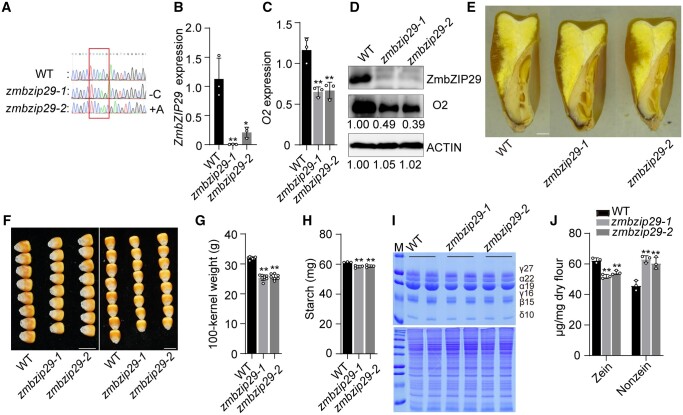
Phenotypes and biochemical analysis of zmbzip29 seeds. A, The CRISPR-Cas9 edited sequence of ZmbZIP29. Two independent knockout lines with a single-nucleotide “C” deletion (zmbzip29-1) and “A” insertion (zmbzip29-2) were recovered in the B104 background, respectively. B and C, RT-qPCR analysis of ZmbZIP29 (B) and O2 (C) expression in 18-DAP wild-type and zmbzip29 seeds. All expression levels were normalized to that of ZmActin. Error bars represent SD of three biological replicates. Statistical significance was determined with Student’s t test. *P < 0.05; **P < 0.01. D, Immunoblot analysis of the protein levels of ZmbZIP29 and O2 in 18-DAP zmbzip29 seeds. Antibodies against ZmbZIP29 and O2 were used at a dilution of 1:1,000 and ACTIN antibodies at a dilution of 1:4,000. The relative protein levels were determined using ImageJ software. E, Longitudinal sections of wild-type and zmbzip29 seeds. Bar = 1 mm. F, Seed phenotypes of the wild type and zmbzip29 mutants. Left panel, kernel width; right panel, kernel length. Bars = 1 cm. G, Measurement of 100-kernel weight. Error bars represent SD of seven biological replicates. Statistical significance was determined with Student’s t test. **P < 0.01. H, Measurement of starch content. Error bars represent SD of three biological replicates. Statistical significance was determined with Student’s t test. **P < 0.01. I, SDS–PAGE analysis of zein (top panel) and nonzein (bottom panel) proteins. The size of each zein protein band is indicated beside it. M, markers; γ27, 27-kD γ-zein; α22, 22-kD α-zein; α19, 19-kD α-zein; γ16, 16-kD γ-zein; β15, 15-kD β-zein; δ10, 10-kD δ-zein. J, Quantification of zein and nonznein proteins. In total, five kernels were ground into fine flour for each replicate and three replicates from three independent ears were performed. Statistical significance was determined with Student’s t test. **P < 0.01.

