Figure 3.
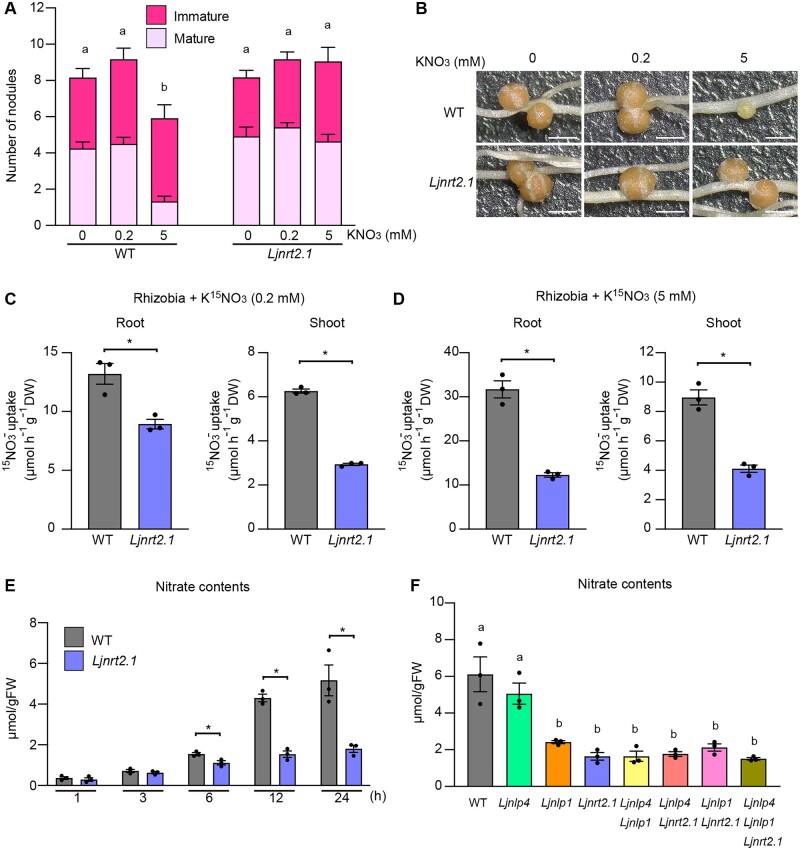
The capacity for nitrate uptake in the Ljnrt2.1 mutants. A and B, Nodule number and nodulation phenotypes of the WT and Ljnrt2.1-1 mutants in the presence of 0, 0.2, or 5 mM KNO3 at 21 dai (n = 11–12 plants). Scale bars = 1 mm. C and D, The capacity for nitrate uptake by the WT and Ljnrt2.1-1 mutants root and shoot in 0.2 (C) and 5 mM (D) KNO3 in the presence of rhizobia. The plants were grown with 0.2 or 5 mM KNO3 for 12 days in the presence of rhizobia. They were then treated with same concentration of K15NO3 for 24 h (n = 3 independent pools of roots derived from 12 plants). E, Temporal changes in the nitrate contents of noninoculated roots of the WT and Ljnrt2.1-1 mutants after treatment with 10 mM KNO3 (n = 3 independent pools of roots derived from seven plants). F, The nitrate contents of noninoculated roots of the WT and seven respective mutants 24 h after treatment with 10 mM KNO3 (n = 3 independent pools of roots derived from seven plants). Error bars indicate sem. *P < 0.05 by a two-sided Welch’s t test (C–E). Different letters indicate statistically significant differences (P < 0.05, one-way ANOVA followed by multiple comparisons) (A) and (F).

