FIGURE 2.
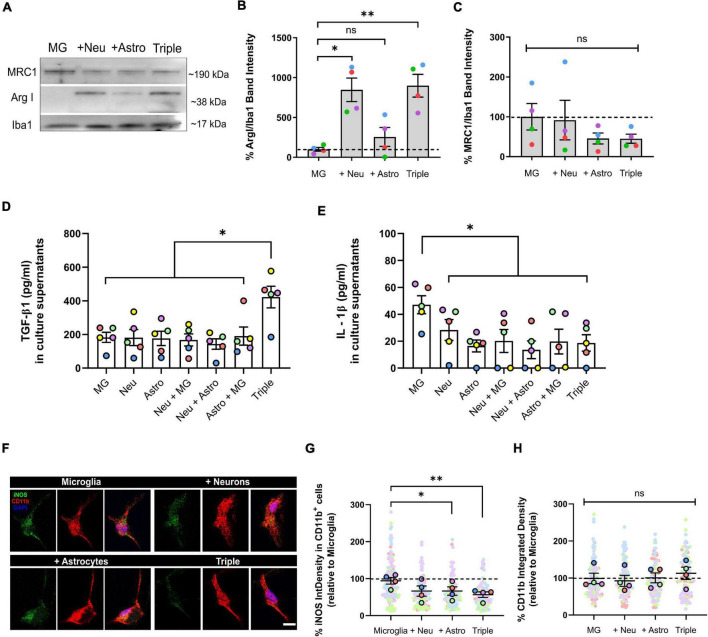
Microglia increased the expression of anti-inflammatory markers ArgI and TGF-β1, and decreased pro-inflammatory markers IL-1β and iNOS in the triple co-culture model. (A) Representative western blot image of microglial markers in total cell lysates. (B) Quantification of anti-inflammatory marker ArgI (n = 4). (C) Quantification of anti-inflammatory marker MRC1 (n = 4). Data was normalized using the marker Iba1 in order to selectively control for microglia. (D) ELISA quantification of anti-inflammatory cytokine TGF-β1 in culture supernatants (n = 5). (E) ELISA quantification of pro-inflammatory cytokine IL-1β in culture supernatants (n = 5). (F) Representative image microglial markers CD11b and iNOS in individual cells. Scale bar = 10 μm. (G) Quantification of the integrated density of iNOS inside CD11b+ cells (n = 4). (H) Quantification of the integrated density of CD11b (n = 4). Each bar represents the mean ± SEM. *p < 0.05; **p < 0.01; ns, not significant. For quantification, 5–6 random fields per condition were used. Neu, neurons; MG, microglia; Astro, astrocytes; ArgI, arginase I, IntDensity, integrated density.

