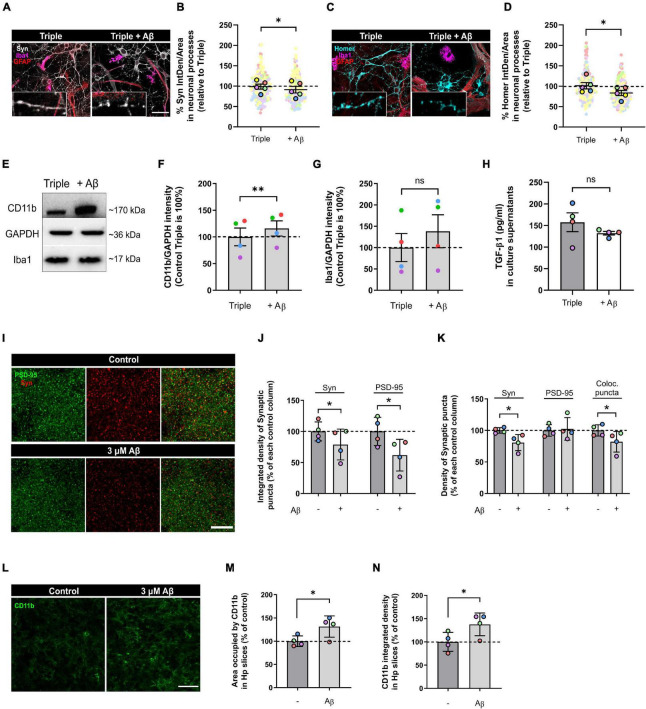
FIGURE 4.
Oligomeric Aβ reduced pre- and post-synaptic puncta and increased microglial expression of CD11b in the triple co-culture and in hippocampal organotypic slices. (A) Representative image of Synaptophysin in neuronal processes. Scale bar = 40 μm. (B) Quantification of Synaptophysin in the triple co-culture after oAβ treatment (n = 5). (C) Representative image of Homer1 in neuronal processes. Scale bar = 40 μm. (D) Quantification of Homer1 in the triple co-culture with oAβ (n = 5). (E) Western blot image of microglial markers in total lysates. (F) Quantification of CD11b in the triple co-culture (n = 4). (G) Quantification of Iba1 expression (n = 4). Raw data was normalized with GAPDH. (H) ELISA quantification of TGF-β1 in culture supernatants (n = 4). (I) Representative images of synaptic markers puncta in hippocampal organotypic slices. Scale bar = 10 μm. (J) Integrated density of Synaptophysin and PSD-95 in organotypic cultures after oAβ treatment (n = 4). (K) Quantification of the puncta density of Synaptophysin, PSD-95 and the colocalization of both markers (n = 4). (L) Representative image of CD11b staining in hippocampal organotypic slices. Scale bar = 40 μm. (M) Area occupied by CD11b staining after oAβ treatment (n = 4). (N) Integrated density of CD11b (n = 4). Each bar represents the mean ± SEM. *p < 0.05; **p < 0.01; ns, not significant. For quantification, 5–6 random fields and 4 random fields per condition were quantified in triple co-cultures and organotypic cultures, respectively. Syn, synaptophysin.

