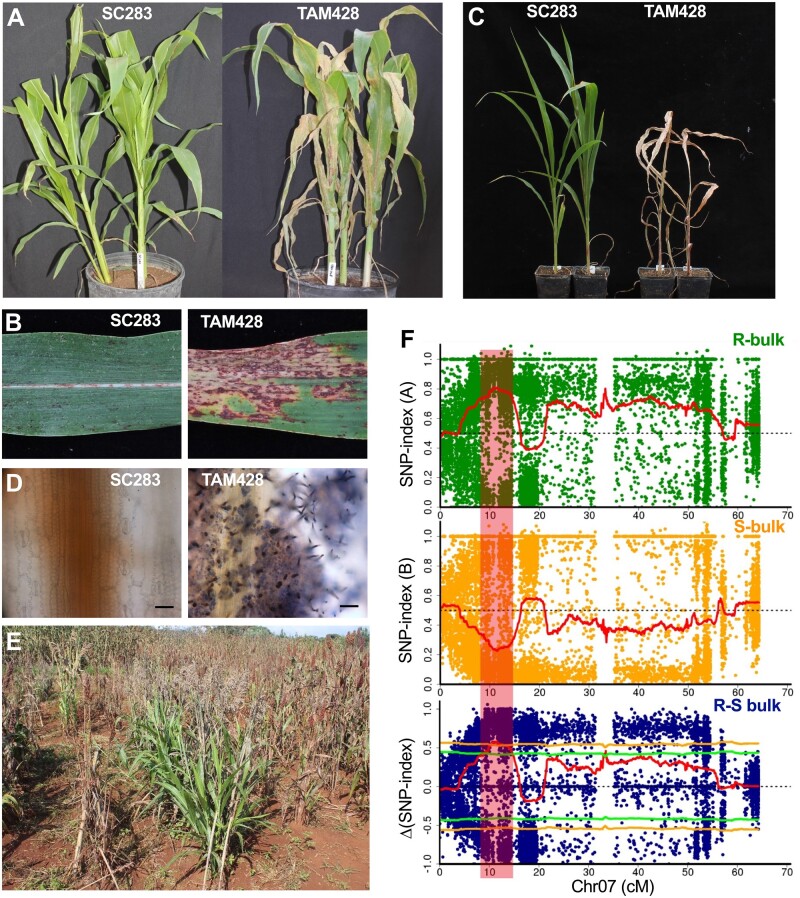
Figure 1.
Disease responses of sorghum lines SC283 and TAM428 to Cs and identification of the resistance locus. A, C, Disease response phenotypes at 7-day post inoculation (dpi) (A), and 14 dpi (C). B, Disease symptoms on infected leaves at 10 dpi, (D) Trypan blue staining of Cs inoculated leaves showing fungal structures on TAM428 but a lack of fungal growth in SC283. Inoculated leaf tissues were stained with trypan blue, and samples were examined under a microscope to visualize fungal material. Scale bars represent 20 μm. E, Resistance of SC283 to foliar pathogens in the field under natural infestation. The experiments were repeated at least three times with similar results. In all the disease response data shown in (A)–(D), the Cs strain Csgl2 was used. F, Identification of an anthracnose resistance QTL in SC283 though QTL-seq analysis of recombinant inbred lines. SNP-index plots of R-bulk (top) and S-bulk (middle), and Δ (SNP-index) plot (bottom) of chromosome 7 with statistical confidence intervals under the null hypothesis of no QTLs (green, P < 0.05; yellow, P < 0.01). The Δ (SNP-index) plot was obtained by subtracting the of S-bulk SNP-index from the R-bulk SNP-index for the RILs. Plants were scored as resistant or susceptible based on their disease symptom or resistance response phenotypes. The DNAs from resistant or susceptible plants were bulked to make separate resistant (R) and susceptible (S) DNA bulks. S-bulk, DNA from the susceptible plants, R-bulk, DNA from the resistant plants. SNP index and Δ (SNP-index) was determined as described.

