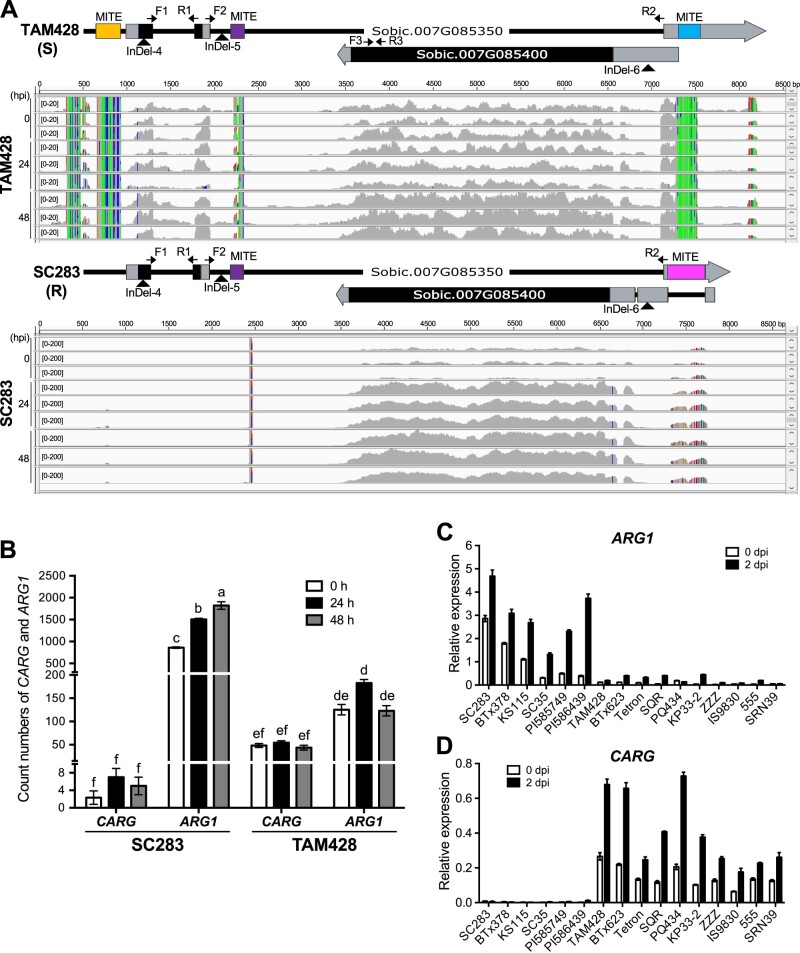
Figure 3.
Genomic structure and RNA-seq analysis of the CARG and ARG1 genes and upstream regulatory elements. A, Genomic structure of the CARG–ARG1 locus. The lower panel shows RNA-seq analysis of the CARG–ARG1 locus. RNA-seq was conducted at 0, 24, and 48 h after inoculation with Cs. Sequence reads were viewed by IGV and mapped to the TAM428 and SC283 genomic sequences of CARG and ARG1. The transcript count data are shown at 0–200 scale for SC283 and 0–20 scale for TAM428 due to the elevated levels of the transcripts for ARG1 in SC283. The mapped transcripts, 5′- and 3′-RACE, qRT-PCR, and genomic sequence data were used to determine the exon, introns, and UTRs of CARG and ARG1. B, Expression of CARG and ARG1 in SC283 and TAM428 based on RNA-seq transcript count data. Error bars indicate the standard deviation of three libraries (error bars ± sd [n = 3]). Different letters indicate significant difference based on the least significant difference (LSD, P < 0.05). C ARG1 and D CARG expression in different sorghum lines. In (C) and (D), expression levels were analyzed by qRT-PCR in independent sorghum genotypes at 0 and 2 days after Cs inoculation. Data were normalized by the comparative cycle threshold method with Actin as the internal control and presented as relative expression. The data represent mean ± sd (n = 3 biological replicates per genotype, collected from one independent experiment). Similar results were obtained in two independent experiments.

