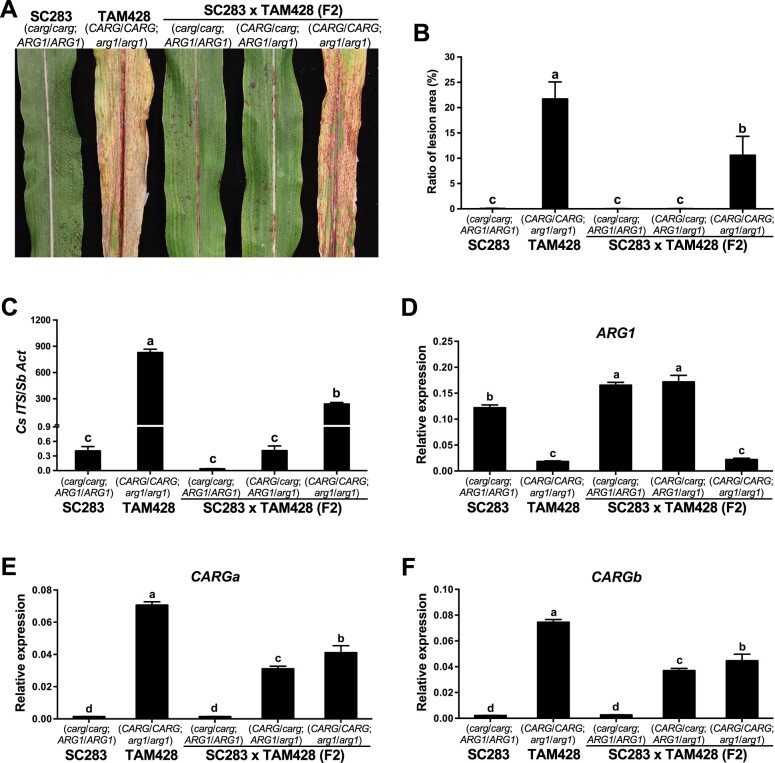
Figure 5.
ARG1 and CARG show contrasting expression patterns and inheritance. A Disease responses, (B) area of disease lesions, and (C) quantification of fungal growth in F2 plants with different CARG and ARG1 alleles. In (B), the ratio of lesion area (%) is presented as mean ± sd obtained from five inoculated leaves. Different letters indicate statistically significant differences (P < 0.05, Student’s t test). In (C), fungal growth in infected leaves was determined by qPCR amplification of the Cs Internal Transcribed Spacer rDNA (Cs ITS). Relative DNA levels were calculated using SbActin (Sb Act) as a reference gene. Data represent mean ±se from three independent biological replicates. Data from each biological replicate consisted of nine technical replicates. Different letters indicate statistically significant differences (P < 0.05, Student’s t test). D, ARG1 and (E and F) CARG expression in SC283, TAM428 and F2 plants. The CARGa primer set flanks the second CARG intron, and the CARGb primer pair flank the first intron of CARG. In (D–F), the expression levels were analyzed by qRT-PCR in SC283, TAM428, and F2 plants. Data were normalized by the comparative cycle threshold method with Actin as the internal control and presented as relative expression. The data represent at least four biological repeats with three technical replicates. Error bars show ± se (n ≥ 24). Different letters indicate significant differences among genotypes (P < 0.05, Student’s t test). Similar results were obtained in three independent experiments.

