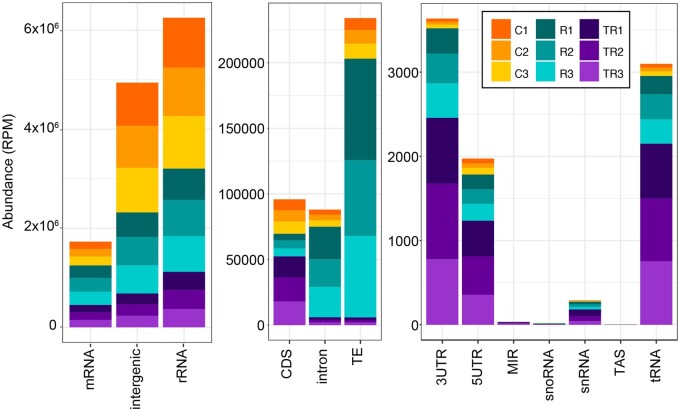
Figure 8.
Apoplastic RNA is derived from multiple sources and is enriched in intergenic RNA. RNA-seq reads were mapped to the Arabidopsis genome and categorized as indicated on the x-axis and quantified on the y-axis as RPM. Note the difference in scales for the three graphs, which were used to better visualize the lower abundance categories. Reads that mapped to protein coding genes (mRNA, left graph) were further categorized as mapping to the 5′-UTR, the 3′-UTR, the protein coding sequence (CDS), or introns. MIR, miRNA encoding gene; snRNA, TAS, trans-acting siRNA-producing loci. The values for three independent biological replicates (P40 pellets isolated from different plants) from each of three treatments are shown. Treatments were: control untreated RNA (C1–C3), RNase A-treated RNA (R1–R3), and trypsin plus RNase A-treated RNA (TR1–TR3).

