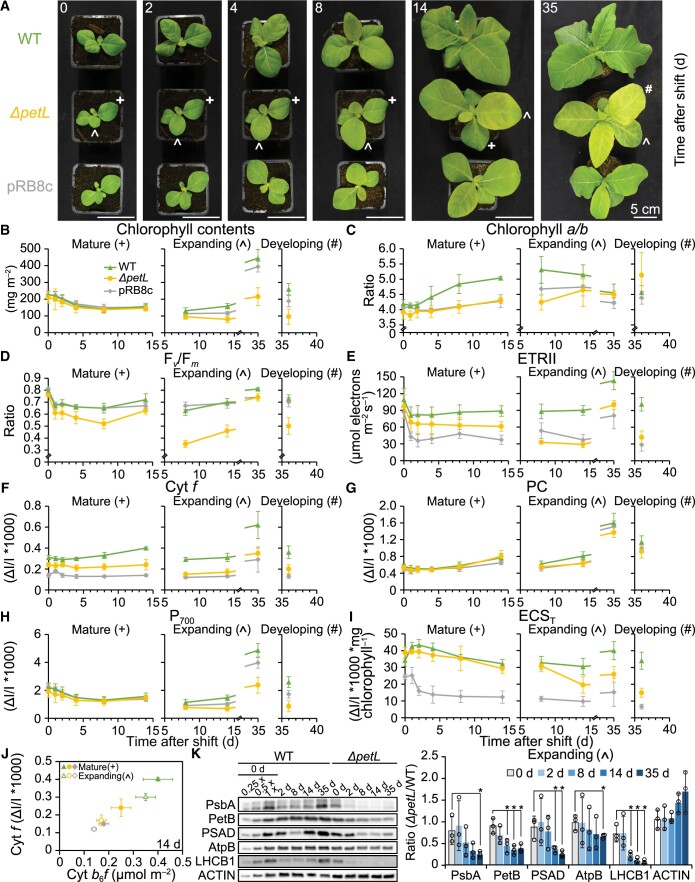
Figure 10.
Impaired photosynthetic cold acclimation of the ΔpetL mutant. A, Phenotypes of WT, ΔpetL and pRB8c plants at the indicated time points after cold shift. These cold-shift experiments were repeated 3 times with at least eight plants, displaying similar cold-induced chlorotic phenotypes for ΔpetL mutants. Mature and expanding leaves used for experiments shown in B-K are labeled with crosses and circumflexes, respectively, in the ΔpetL mutant. A leaf that fully developed (i.e. newly emerged; referred to as “developing leaf”) in the cold is labeled with a hashtag and was analyzed 36 days after cold shift. B–I, Photosynthetic parameters of mature and expanding leaves of WT (green), ΔpetL (yellow) and pRB8c (gray) plants at the indicated time points (d) after cold shift: chlorophyll contents (B), chlorophyll a/b ratio (C), maximum quantum efficiency of PSII in the dark-adapted state (Fv/Fm) (D), maximum capacity of linear electron transport (ETRII) (E), in vivo contents of redox-active cyt f (F), in vivo contents of redox-active plastocyanin (PC) (G), in vivo accumulation of the PSI reaction center (P700) (H), and maximum amplitude of the electrochromic absorption shift (ECST) (I). In (B) and (F–H), data were normalized to leaf area. The data from leaves that expanded in the cold (labeled with circumflex) were separated from data obtained from the developing leaf (leaf that fully developed, that is, newly emerged in the cold) (labeled with hashtag) by vertical dashed gray lines. In (B–I), the statistically significant differences of results are shown in Supplemental Data Set 4. J, Correlation between the maximum difference transmittance signal of cyt f with the contents of cyt b6f complex per leaf area in mature and expanding leaves of WT, ΔpetL and pRB8c plants at 14 days after cold shift. In (B–J), all in vivo measurements were performed on intact leaves. PSI was quantified using the difference transmission signal of P700. cyt f serves as a proxy of redox-active cyt b6f complex. ECST serves as a measure for the light-induced pmf across the thylakoid membrane. Error bars indicate the standard deviation of measurement results from at least seven individual plants used as independent biological replicates for in vivo measurements, and at least three thylakoid isolations each using at least ten individual plants as independent biological replicates for photosynthetic complex quantification (data shown in Table 1). K, Immunoblot analyses of core subunits of major photosynthetic complexes in expanding leaves of WT and ΔpetL mutant plants at the indicated time points after cold shift. Error bars indicate the standard deviation of results obtained from three individual plants used as independent biological replicates (quantification details in Supplemental Figure S10). Asterisks indicate statistically significant differences of the ratios (ΔpetL/WT) for the indicated time points after cold shift compared with the 0-day control (P < 0.05, two-sided Student’s t test, Supplemental Data Set 1).

