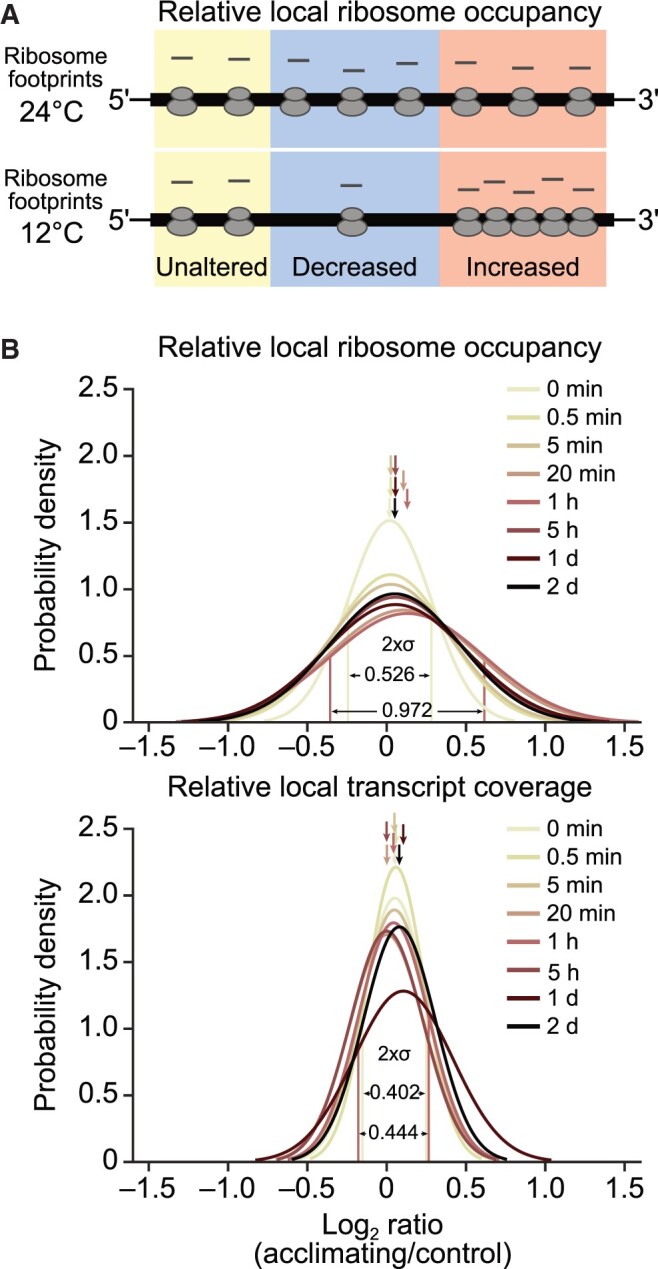
Figure 8.

Locally altered distribution of chloroplast ribosomes during acclimation to low temperature. A, Schematic diagram showing hypothetical cold-induced local changes in relative ribosome occupancy (i.e. ribosome redistribution) of a reading frame (thick horizontal line) whose overall translation output is unaltered after cold shift (thin lines depict untranslated regions). Regions with locally unaltered, decreased and increased relative ribosome occupancy are shaded in yellow, blue, and red, respectively. Note that the overall ribosome loading of the reading frame is unaltered. B, Probability density plots of locally altered relative ribosome occupancies (upper) and virtually unaltered relative local transcript coverage (lower) during cold acclimation. For each probe in protein-coding regions, relative local ribosome occupancy and transcript coverage were determined as described previously (Schuster et al., 2020), respectively, and a ratio calculated between acclimating and control plants for each acclimation time point. The distribution of these ratios was visualized in probability density plots, which show the estimated Gaussian distribution of log2-transformed fold changes at the indicated time points after shift. The region of [–σ,σ] (representing 68.27% of the area under the density curve, σ: standard deviation) is labeled for relative local ribosome occupancy and transcript coverage at 1-h time point (displaying maximum change of local ribosome distribution after cold shift) and 0-min control. Average distribution numbers are marked by arrows and are shown with σ values in Supplemental Table S1. Results are based on three independently analyzed individual plants as biological replicates. Note that the 1-day time point of relative local transcript coverage showed slightly lower reproducibility (i.e. higher median standard deviation of biological replicates) possibly explaining its slightly different distribution.
