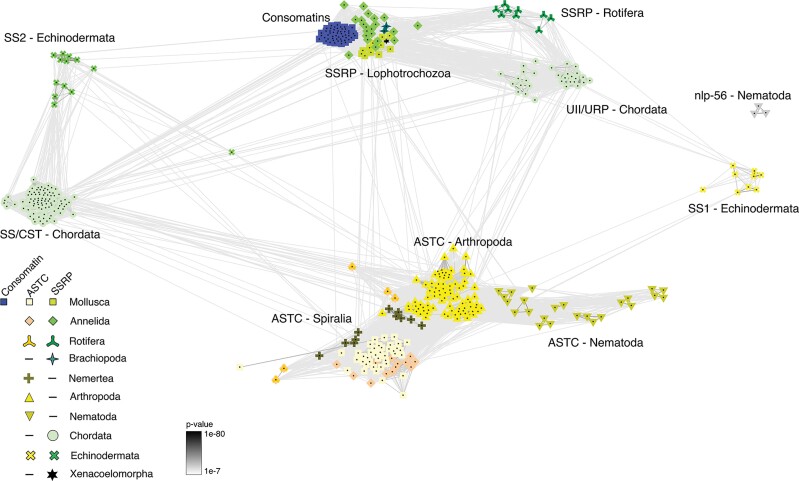
Fig. 6.
BLOSUM62 cluster map of SSRP, SSRP-like, and ASTC peptide precursors. The depicted notes represent individual precursor molecules, edges correspond to BLAST P-values > 1e−7. Nodes are labeled with phylum-specific colors indicated in the legend, but landmarks are also placed within the map for phyla or superphyla (Lopohotrochozoa: Mollusca, Annelida, Brachiopoda. Spiralia: Mollusca, Annelida, Rotifera, Nemertea).

