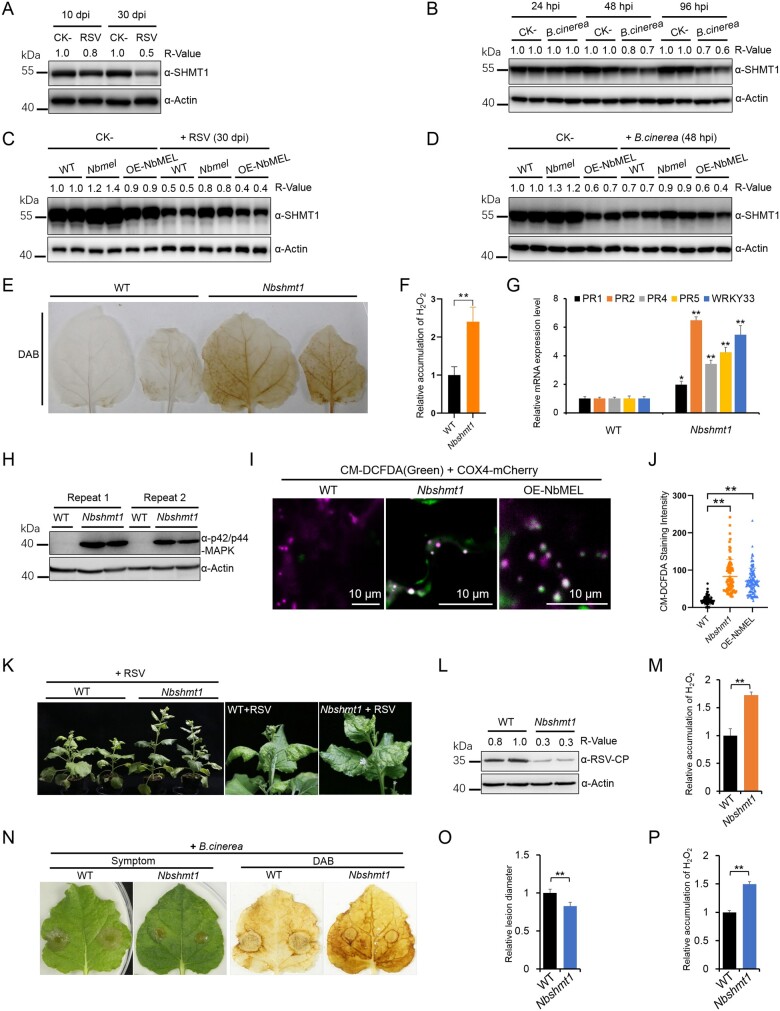
Figure 4.
Downregulation of NbSHMT1 mediated by NbMEL initiates plant immune signaling. A, Endogenous NbSHMT1 accumulation in mock (CK-) and RSV-infected N. benthamiana systemic leaves at 10 dpi and 30 dpi, respectively. Actin was used as a loading control. B, Endogenous NbSHMT1 accumulation in mock (CK-) and B. cinerea infected N. benthamiana leaves at 24, 48, and 96 hpi, respectively. Actin was used as a loading control. C, Endogenous NbSHMT1 accumulation in mock (CK-) and RSV infected WT, NbMEL overexpressing transgenic (OE-NbMEL), and NbMEL knockout (Nbmel) N. benthamiana plants at 30 dpi. Actin was used as a loading control. D, Endogenous NbSHMT1 accumulation in mock (CK-) and B. cinerea infected WT, OE-NbMEL, and Nbmel N. benthamiana plants at 48 hpi. Actin was used as a loading control. E, DAB staining of WT and Nbshmt1 N. benthamiana leaves. F, Relative H2O2 accumulation in WT and Nbshmt1 N. benthamiana leaves was measured by Amplex red. G, Defense-related gene expression in WT and Nbshmt1 N. benthamiana plants detected by RT-qPCR. Data are means ± sd (n = 3). H, MAP kinase phosphorylation assay in WT and Nbshmt1 N. benthamiana leaves. Immunoblot analysis was performed using an anti p42/p44-MAPK antibody. Actin was used as a loading control. I, Photographs of representative CM-H2DCFDA staining in mitochondria of WT, OE-NbMEL and Nbshmt1 N. benthamiana leaf epidermal cells. Bar: 10 μm. J, Comparison of fluorescence intensity of mtROS stained by CM-H2DCFDA in WT, OE-NbMEL, and Nbshmt1 N. benthamiana leaf epidermal cells. COX4-mCherry was used as a mitochondrial marker. Bar: 10 μm. Data are means ± sd (n = 100). K, Photographs of representative RSV symptoms in WT and Nbshmt1 N. benthamiana plants at 20 dpi. L and M, RSV CP accumulation (L) and relative quantification of H2O2 accumulation (M) in RSV-infected systemically leaves of WT and Nbshmt1 N. benthamiana plants at 20 dpi. Actin was used as a loading control. N–P, Photographs of representative lesions and DAB staining (N), relative lesion diameter (O), and relative quantification of H2O2 (P) of B. cinerea-infected leaves of WT and Nbshmt1 N. benthamiana plants at 96 hpi. Lesion size was measured at 3 dpi, Data are means ± sem (n = 10). In (F), (M), and (P), H2O2 accumulation was measured by Amplex red. Data are means ± sd (n = 3). In (F), (G), (J), (M), (O), and (P), asterisks mark significant differences according to two-tailed Student’s t test, **P < 0.01. In (A–D) and (L), the bands in immunoblots were quantified and the relative intensities (R-value) are shown above the band. All the experiments were performed 3 times with similar results.

